Foreign-born population in the EU countries
Topic: Population and health
In Luxembourg, 51.03% of the population was born in another country, against 2.56% in Poland.
On 1 January 2024, 13.94% of the people living in the EU were born in another country. The country of birth is the mother's country of residence at the time of the birth.
- Figures for:
- 2024.
- Covers:
- one day.
- New data:
- once a year.
- Dataset updated:
- 25 September 2026.
Published 6 November 2026
The ranking
On 1 January 2024, the share of the population born in another country was lowest in Poland, at 2.56%, and highest in Luxembourg, at 51.03%.
Share of the population born in another country, %
2024Over time
From 2015 to 2024, the EU figure rose from 10.00% to 13.94%.
Share of the population born in another country in the EU, %
2015–2024Between 2015 and 2024, the share fell in 2 countries and rose in 25.
Share of the population born in another country, %
2015 and 2024 · ranked by 2024Born outside the EU or in another EU country
Counting only people born in another EU country, the spread across countries was much narrower. Poland was again the lowest, at 0.64%, and Luxembourg again the highest, at 32.88%. The gap between Luxembourg and Poland was 32.24 percentage points.
Counting only people born outside the EU, the spread across countries was narrower than counting only people born in another EU country. It ranged from 1.08% in Slovakia to 23.56% in Malta. The highest and the lowest were 22.48 percentage points apart.
Share of the population born in another country: born in another EU country and born outside the EU, %
2024| Born in another country | Born in another EU country | Born outside the EU | |
|---|---|---|---|
| Lowest | 2.56%Poland | 0.64%Poland | 1.08%Slovakia |
| Highest | 51.03%Luxembourg | 32.88%Luxembourg | 23.56%Malta |
| Highest − lowest | 48.47 pp | 32.24 pp | 22.48 pp |
Age groups
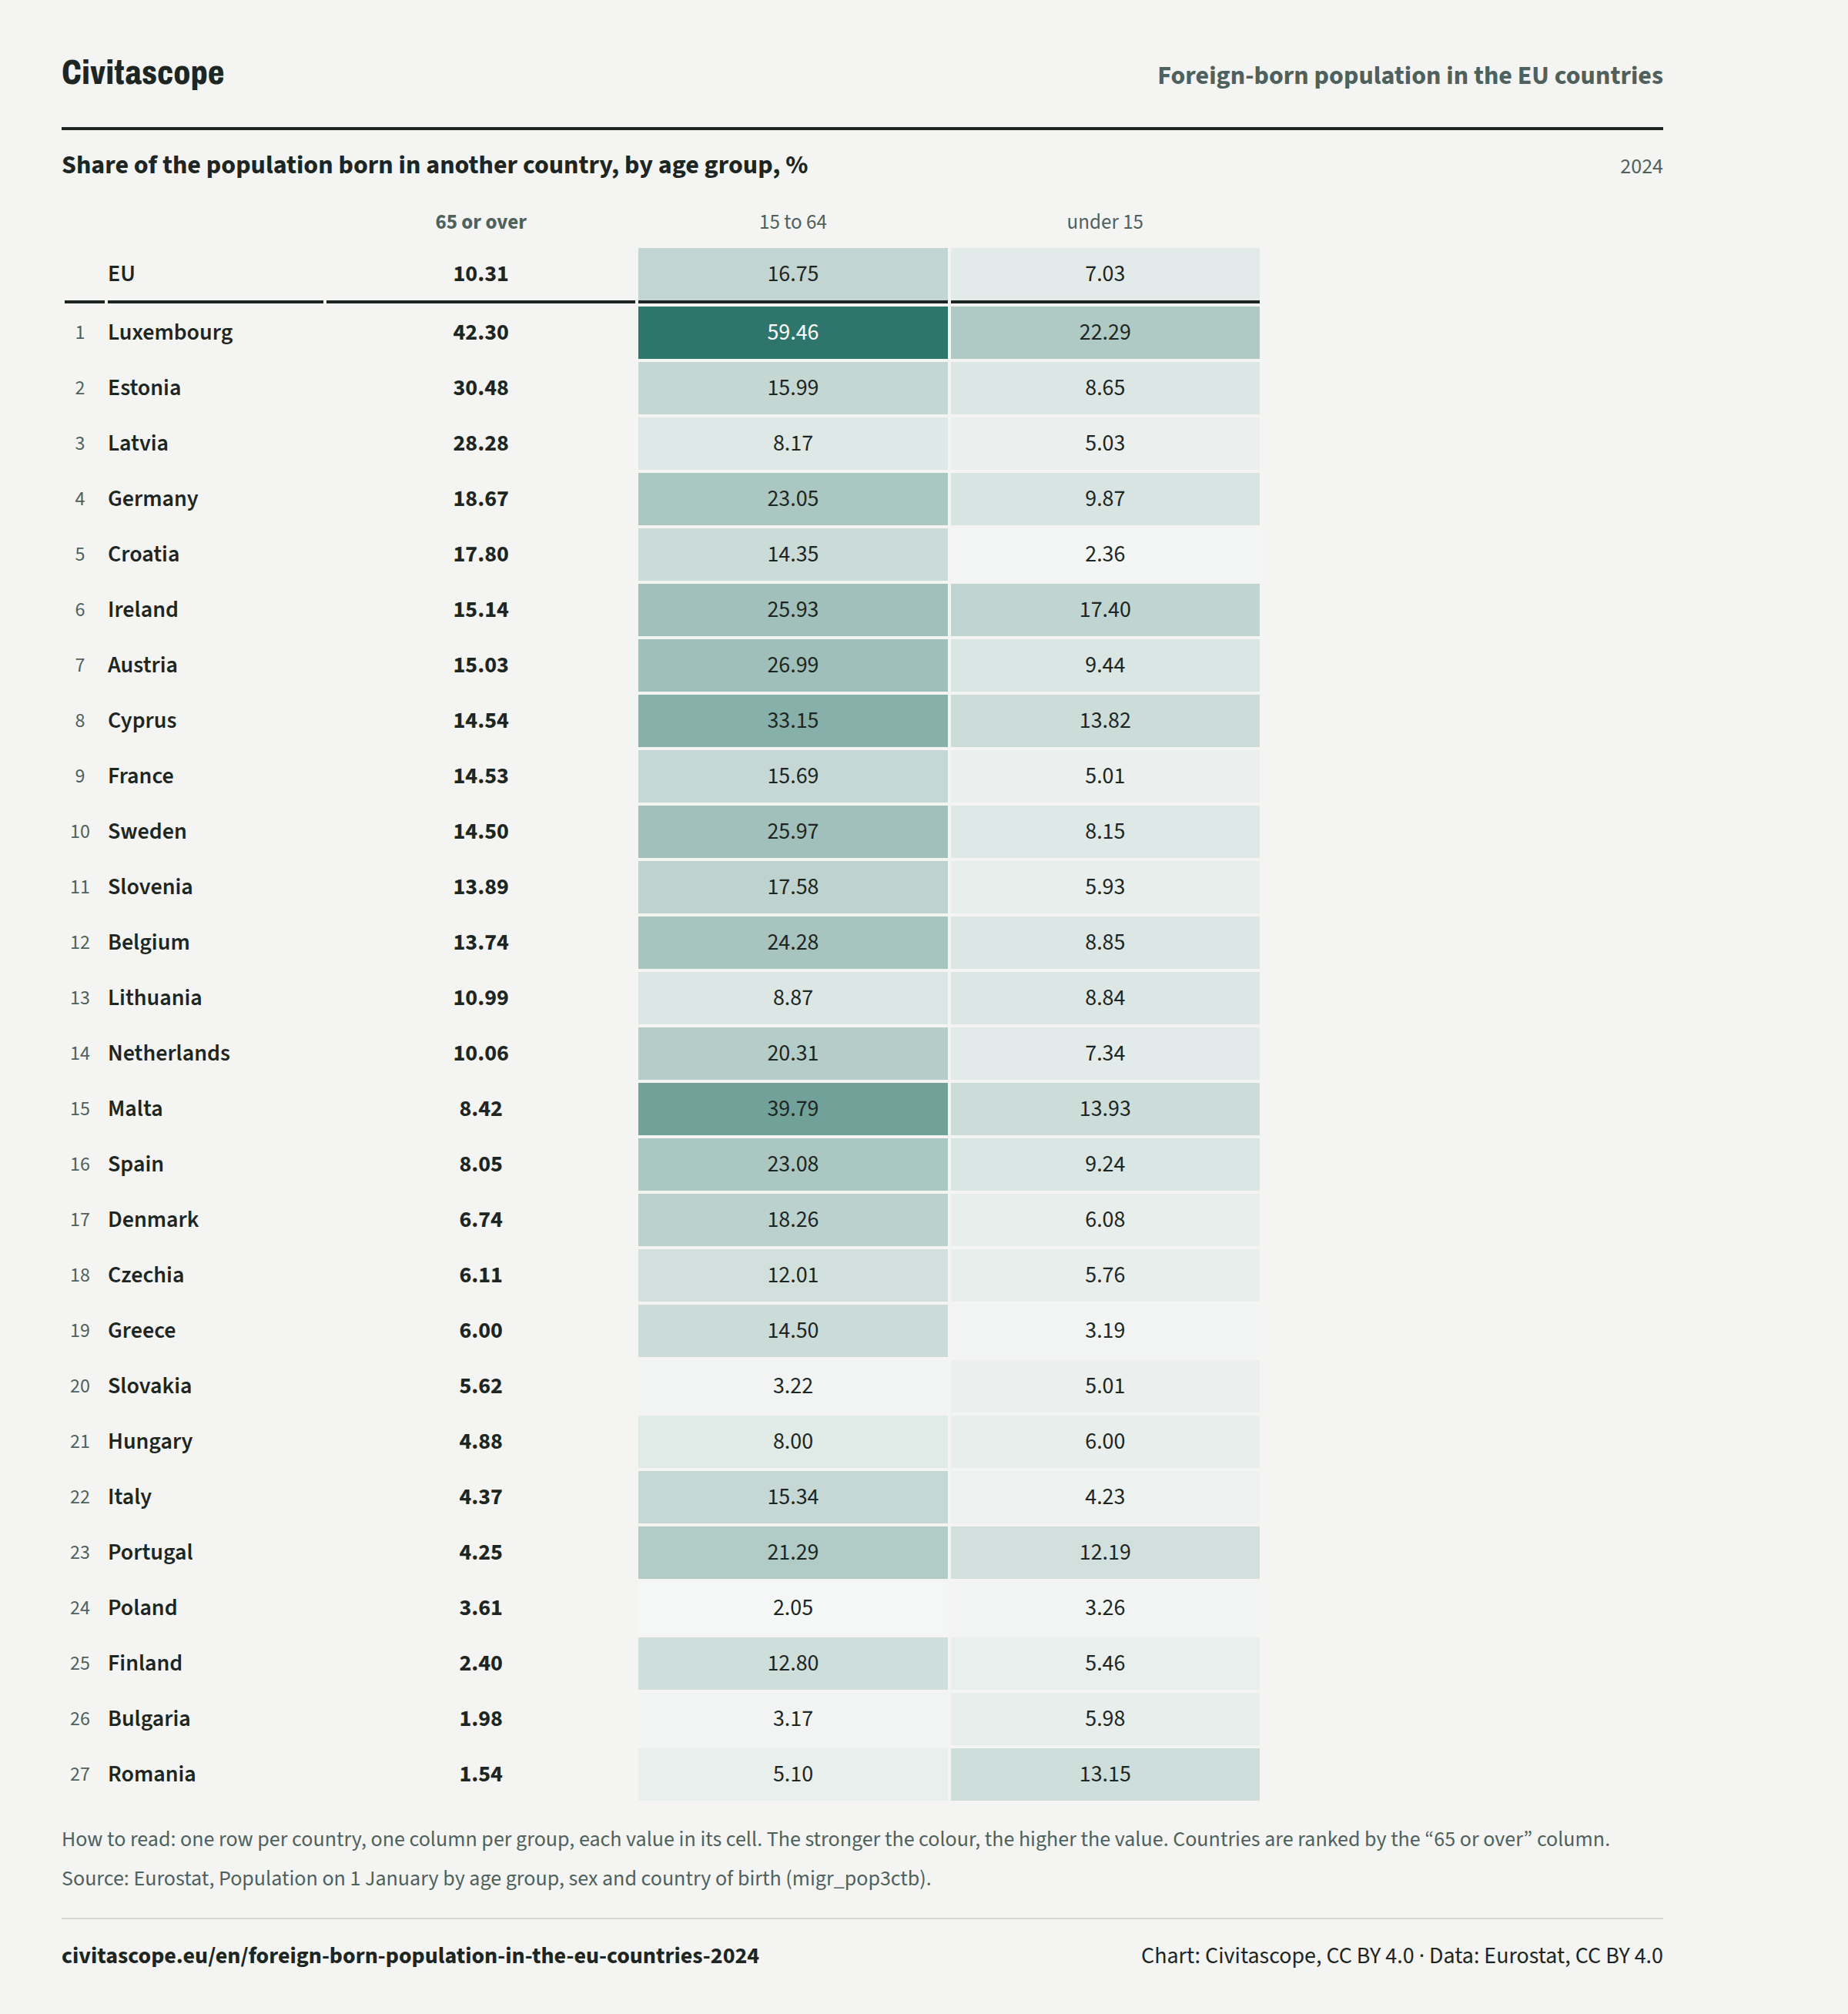
On 1 January 2024, 16.75% of the people aged 15 to 64 living in the EU were born in another country, against 10.31% of those aged 65 or over and 7.03% of children under 15.
Share of the population born in another country, by age group, %
2024| 65 or over | 15 to 64 | under 15 | ||
|---|---|---|---|---|
| EU, | 65 or over: 10.31 %, | 15 to 64: 16.75 %, | under 15: 7.03 %, | |
| Rank 1: | Luxembourg, | 65 or over: 42.30 %, | 15 to 64: 59.46 %, | under 15: 22.29 %, |
| Rank 2: | Estonia, | 65 or over: 30.48 %, | 15 to 64: 15.99 %, | under 15: 8.65 %, |
| Rank 3: | Latvia, | 65 or over: 28.28 %, | 15 to 64: 8.17 %, | under 15: 5.03 %, |
| Rank 4: | Germany, | 65 or over: 18.67 %, | 15 to 64: 23.05 %, | under 15: 9.87 %, |
| Rank 5: | Croatia, | 65 or over: 17.80 %, | 15 to 64: 14.35 %, | under 15: 2.36 %, |
| Rank 6: | Ireland, | 65 or over: 15.14 %, | 15 to 64: 25.93 %, | under 15: 17.40 %, |
| Rank 7: | Austria, | 65 or over: 15.03 %, | 15 to 64: 26.99 %, | under 15: 9.44 %, |
| Rank 8: | Cyprus, | 65 or over: 14.54 %, | 15 to 64: 33.15 %, | under 15: 13.82 %, |
| Rank 9: | France, | 65 or over: 14.53 %, | 15 to 64: 15.69 %, | under 15: 5.01 %, |
| Rank 10: | Sweden, | 65 or over: 14.50 %, | 15 to 64: 25.97 %, | under 15: 8.15 %, |
| Rank 11: | Slovenia, | 65 or over: 13.89 %, | 15 to 64: 17.58 %, | under 15: 5.93 %, |
| Rank 12: | Belgium, | 65 or over: 13.74 %, | 15 to 64: 24.28 %, | under 15: 8.85 %, |
| Rank 13: | Lithuania, | 65 or over: 10.99 %, | 15 to 64: 8.87 %, | under 15: 8.84 %, |
| Rank 14: | Netherlands, | 65 or over: 10.06 %, | 15 to 64: 20.31 %, | under 15: 7.34 %, |
| Rank 15: | Malta, | 65 or over: 8.42 %, | 15 to 64: 39.79 %, | under 15: 13.93 %, |
| Rank 16: | Spain, | 65 or over: 8.05 %, | 15 to 64: 23.08 %, | under 15: 9.24 %, |
| Rank 17: | Denmark, | 65 or over: 6.74 %, | 15 to 64: 18.26 %, | under 15: 6.08 %, |
| Rank 18: | Czechia, | 65 or over: 6.11 %, | 15 to 64: 12.01 %, | under 15: 5.76 %, |
| Rank 19: | Greece, | 65 or over: 6.00 %, | 15 to 64: 14.50 %, | under 15: 3.19 %, |
| Rank 20: | Slovakia, | 65 or over: 5.62 %, | 15 to 64: 3.22 %, | under 15: 5.01 %, |
| Rank 21: | Hungary, | 65 or over: 4.88 %, | 15 to 64: 8.00 %, | under 15: 6.00 %, |
| Rank 22: | Italy, | 65 or over: 4.37 %, | 15 to 64: 15.34 %, | under 15: 4.23 %, |
| Rank 23: | Portugal, | 65 or over: 4.25 %, | 15 to 64: 21.29 %, | under 15: 12.19 %, |
| Rank 24: | Poland, | 65 or over: 3.61 %, | 15 to 64: 2.05 %, | under 15: 3.26 %, |
| Rank 25: | Finland, | 65 or over: 2.40 %, | 15 to 64: 12.80 %, | under 15: 5.46 %, |
| Rank 26: | Bulgaria, | 65 or over: 1.98 %, | 15 to 64: 3.17 %, | under 15: 5.98 %, |
| Rank 27: | Romania, | 65 or over: 1.54 %, | 15 to 64: 5.10 %, | under 15: 13.15 %, |
About the data
The number of people living in a country on 1 January who were born in another country. The country of birth is the mother's country of residence at the time of the birth, or else the country where the birth took place. The story shows it as a percentage of the whole population.
Eurostat: “Country of birth is the country of residence (in its current borders, if the information is available) of the mother at the time of the birth or, in default, the country (in its current borders, if the information is available) in which the birth took place.” (source)
Population figures by country of birth reported to Eurostat by the national statistical institutes under the EU regulations on migration statistics and on demographic statistics. Most countries take them from population registers and other administrative sources. Others start from the latest census and add later births, deaths and migration.
How to read these numbers
How it is measured
Country of birth is the mother's country of residence at the time of the birth, in its current borders where this is known. The dataset also lists former states, such as Czechoslovakia, Yugoslavia and the Soviet Union, as countries of birth. People born abroad include citizens of the country who were born elsewhere.
Countries count different populations. Finland reports the legally resident population. Austria, Denmark, Luxembourg, the Netherlands and Sweden, and in part Czechia, Germany and Spain, report the registered population, and the others the usually resident population.
Asylum seekers who have lived in the country for at least 12 months are part of the population in some countries and left out in others. Slovakia leaves out refugees who have lived there for at least 12 months. Finland includes refugees from Ukraine under temporary protection only if they have applied for permanent residence. Coverage of hard-to-reach groups and of immigrants who have not registered their arrival may also differ between countries.
Germany's figures by country of birth are estimated from the distribution of countries of birth in the 2022 census.
Portugal sent Eurostat revised population figures for 2022 to 2025 at the end of June 2026. This dataset still has Portugal's earlier figures, lower than those in Eurostat's demographic balance.
Some people have no known country of birth. They are counted in the whole population but not among those born abroad.
While countries' revisions are being processed, the EU figure may not exactly match the sum of the countries.
France's figures cover the whole country, with its overseas departments. Mayotte has been included since 2014. Cyprus's figures cover the government-controlled area.
Revisions
Bulgaria, Ireland, Spain, Croatia, Italy, Cyprus, Lithuania, Hungary, Malta, Poland and Portugal revised their population figures between the 2011 and 2021 censuses. The revisions were released in 2024 and 2025.
Breaks in the series
Germany's figures by country of birth have a break in the series in 2023. From 2023 on, more people in Germany have no known country of birth.
Sources and data
Eurostat, Population on 1 January by age group, sex and country of birth (migr_pop3ctb). Data updated 25 September 2026, retrieved 6 November 2026. Licence: CC BY 4.0.
Eurostat metadata · Eurostat methodology
https://ec.europa.eu/eurostat/api/dissemination/statistics/1.0/data/migr_pop3ctb?format=JSON&lang=en&age=TOTAL&c_birth=FOR&c_birth=TOTAL&freq=A&geo=AT&geo=BE&geo=BG&geo=CY&geo=CZ&geo=DE&geo=DK&geo=EE&geo=EL&geo=ES&geo=EU27_2020&geo=FI&geo=FR&geo=HR&geo=HU&geo=IE&geo=IT&geo=LT&geo=LU&geo=LV&geo=MT&geo=NL&geo=PL&geo=PT&geo=RO&geo=SE&geo=SI&geo=SK&sex=T&unit=NRRelated stories
-
Net migration plus statistical adjustment in the EU
The crude rate of net migration plus statistical adjustment was 23.9 per 1,000 inhabitants in Malta, and a negative 2.1 per 1,000 inhabitants in Estonia (2025)
-
Healthy life years in the EU countries
A newborn in Italy can expect 73.4 years of life without being limited in usual activities by a health problem, against 52.5 years in Latvia (2024)
-
Unmet needs for medical care in the EU
In Greece, 11.5% of people aged 16 or over went without medical care they needed because of the cost, the distance or a waiting list, against 0.1% in Cyprus and Malta (2025)
-
Excess mortality in the EU countries
11.1% fewer people died in Lithuania than on average in 2016–2019, and 18.0% more in Luxembourg (May 2026)