Net migration plus statistical adjustment in the EU
Topic: Population and health
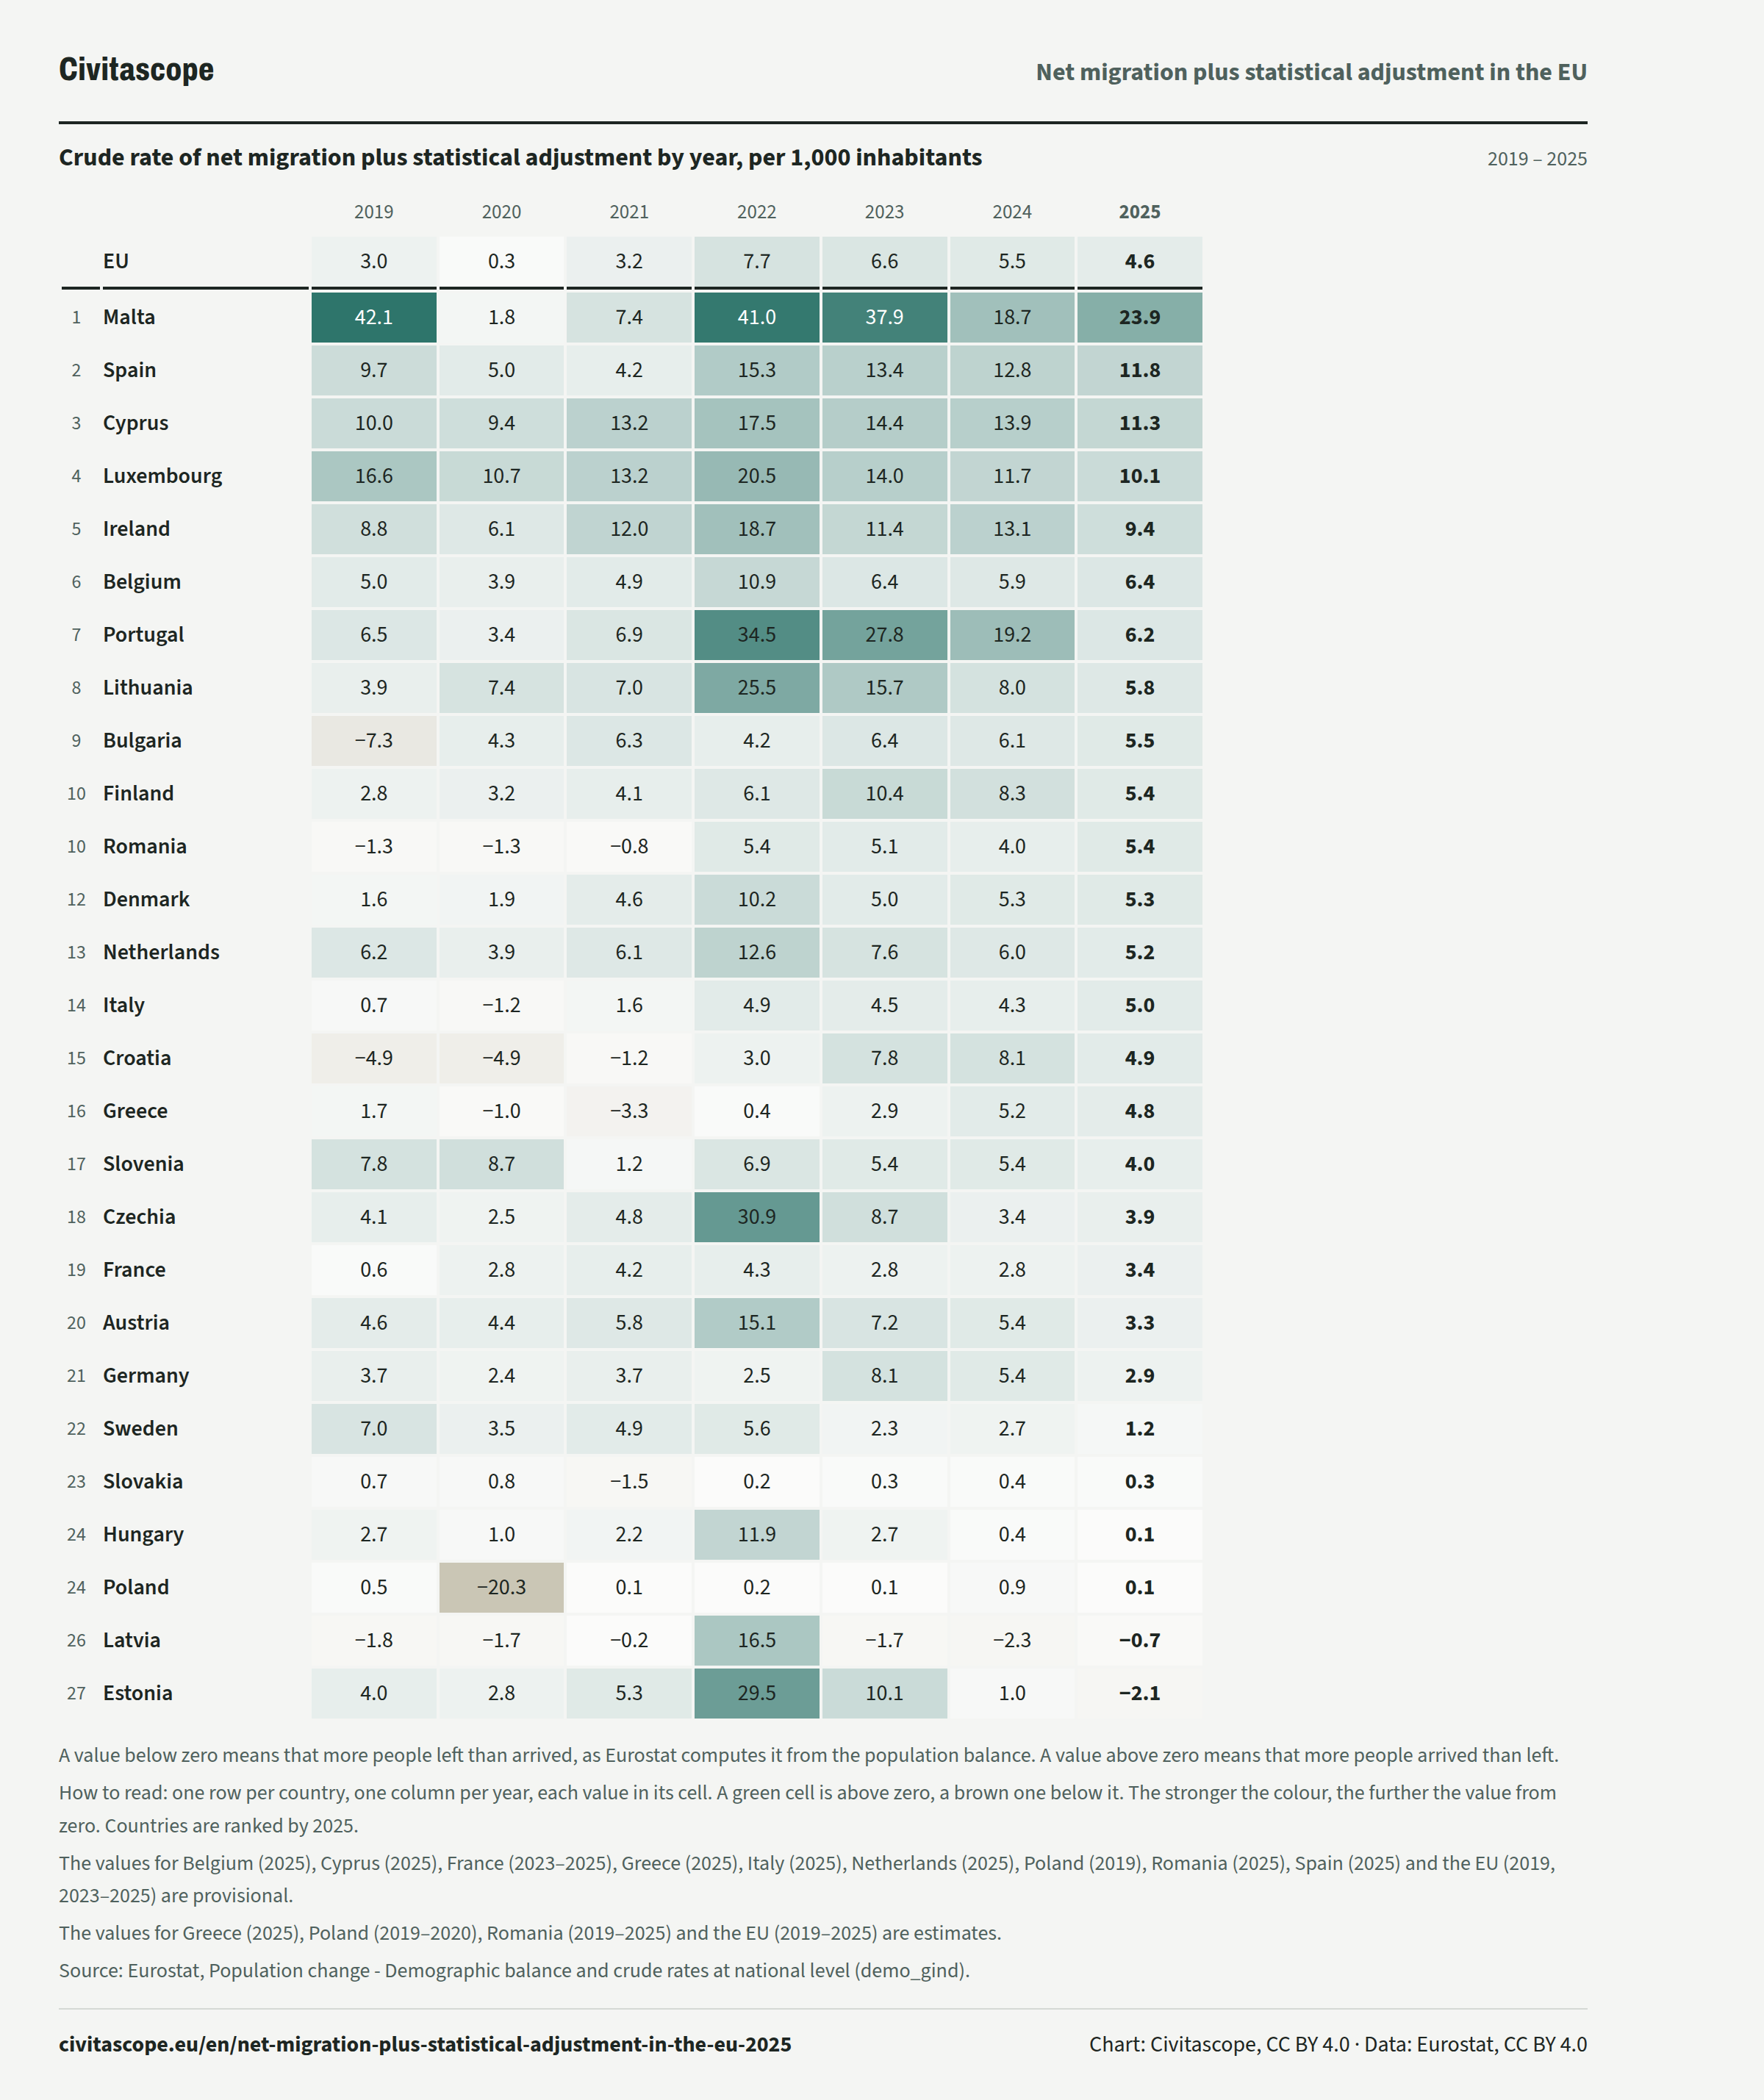
The crude rate of net migration plus statistical adjustment was 23.9 per 1,000 inhabitants in Malta, and a negative 2.1 per 1,000 inhabitants in Estonia.
In 2025, the crude rate of net migration plus statistical adjustment in the EU was 4.6 per 1,000 inhabitants. Eurostat computes it from the change in population, minus the births and plus the deaths of the year.
- Figures for:
- 2025.
- Covers:
- the whole year.
- New data:
- once a year.
- Dataset updated:
- 27 October 2026.
Published 6 November 2026
The ranking
In 2025, the rate was highest in Malta, at 23.9 per 1,000 inhabitants, and lowest in Estonia, at a negative 2.1 per 1,000 inhabitants.
Crude rate of net migration plus statistical adjustment, per 1,000 inhabitants
2025Year by year
In the EU, the rate was 3.0 per 1,000 inhabitants in 2019.
Crude rate of net migration plus statistical adjustment by year, per 1,000 inhabitants
2019 – 2025| 2019 | 2020 | 2021 | 2022 | 2023 | 2024 | 2025 | ||
|---|---|---|---|---|---|---|---|---|
| EU, | 2019: 3.0 per 1,000 inhabitants, | 2020: 0.3 per 1,000 inhabitants, | 2021: 3.2 per 1,000 inhabitants, | 2022: 7.7 per 1,000 inhabitants, | 2023: 6.6 per 1,000 inhabitants, | 2024: 5.5 per 1,000 inhabitants, | 2025: 4.6 per 1,000 inhabitants, | |
| Rank 1: | Malta, | 2019: 42.1 per 1,000 inhabitants, | 2020: 1.8 per 1,000 inhabitants, | 2021: 7.4 per 1,000 inhabitants, | 2022: 41.0 per 1,000 inhabitants, | 2023: 37.9 per 1,000 inhabitants, | 2024: 18.7 per 1,000 inhabitants, | 2025: 23.9 per 1,000 inhabitants, |
| Rank 2: | Spain, | 2019: 9.7 per 1,000 inhabitants, | 2020: 5.0 per 1,000 inhabitants, | 2021: 4.2 per 1,000 inhabitants, | 2022: 15.3 per 1,000 inhabitants, | 2023: 13.4 per 1,000 inhabitants, | 2024: 12.8 per 1,000 inhabitants, | 2025: 11.8 per 1,000 inhabitants, |
| Rank 3: | Cyprus, | 2019: 10.0 per 1,000 inhabitants, | 2020: 9.4 per 1,000 inhabitants, | 2021: 13.2 per 1,000 inhabitants, | 2022: 17.5 per 1,000 inhabitants, | 2023: 14.4 per 1,000 inhabitants, | 2024: 13.9 per 1,000 inhabitants, | 2025: 11.3 per 1,000 inhabitants, |
| Rank 4: | Luxembourg, | 2019: 16.6 per 1,000 inhabitants, | 2020: 10.7 per 1,000 inhabitants, | 2021: 13.2 per 1,000 inhabitants, | 2022: 20.5 per 1,000 inhabitants, | 2023: 14.0 per 1,000 inhabitants, | 2024: 11.7 per 1,000 inhabitants, | 2025: 10.1 per 1,000 inhabitants, |
| Rank 5: | Ireland, | 2019: 8.8 per 1,000 inhabitants, | 2020: 6.1 per 1,000 inhabitants, | 2021: 12.0 per 1,000 inhabitants, | 2022: 18.7 per 1,000 inhabitants, | 2023: 11.4 per 1,000 inhabitants, | 2024: 13.1 per 1,000 inhabitants, | 2025: 9.4 per 1,000 inhabitants, |
| Rank 6: | Belgium, | 2019: 5.0 per 1,000 inhabitants, | 2020: 3.9 per 1,000 inhabitants, | 2021: 4.9 per 1,000 inhabitants, | 2022: 10.9 per 1,000 inhabitants, | 2023: 6.4 per 1,000 inhabitants, | 2024: 5.9 per 1,000 inhabitants, | 2025: 6.4 per 1,000 inhabitants, |
| Rank 7: | Portugal, | 2019: 6.5 per 1,000 inhabitants, | 2020: 3.4 per 1,000 inhabitants, | 2021: 6.9 per 1,000 inhabitants, | 2022: 34.5 per 1,000 inhabitants, | 2023: 27.8 per 1,000 inhabitants, | 2024: 19.2 per 1,000 inhabitants, | 2025: 6.2 per 1,000 inhabitants, |
| Rank 8: | Lithuania, | 2019: 3.9 per 1,000 inhabitants, | 2020: 7.4 per 1,000 inhabitants, | 2021: 7.0 per 1,000 inhabitants, | 2022: 25.5 per 1,000 inhabitants, | 2023: 15.7 per 1,000 inhabitants, | 2024: 8.0 per 1,000 inhabitants, | 2025: 5.8 per 1,000 inhabitants, |
| Rank 9: | Bulgaria, | 2019: −7.3 per 1,000 inhabitants, | 2020: 4.3 per 1,000 inhabitants, | 2021: 6.3 per 1,000 inhabitants, | 2022: 4.2 per 1,000 inhabitants, | 2023: 6.4 per 1,000 inhabitants, | 2024: 6.1 per 1,000 inhabitants, | 2025: 5.5 per 1,000 inhabitants, |
| Rank 10: | Finland, | 2019: 2.8 per 1,000 inhabitants, | 2020: 3.2 per 1,000 inhabitants, | 2021: 4.1 per 1,000 inhabitants, | 2022: 6.1 per 1,000 inhabitants, | 2023: 10.4 per 1,000 inhabitants, | 2024: 8.3 per 1,000 inhabitants, | 2025: 5.4 per 1,000 inhabitants, |
| Rank 10: | Romania, | 2019: −1.3 per 1,000 inhabitants, | 2020: −1.3 per 1,000 inhabitants, | 2021: −0.8 per 1,000 inhabitants, | 2022: 5.4 per 1,000 inhabitants, | 2023: 5.1 per 1,000 inhabitants, | 2024: 4.0 per 1,000 inhabitants, | 2025: 5.4 per 1,000 inhabitants, |
| Rank 12: | Denmark, | 2019: 1.6 per 1,000 inhabitants, | 2020: 1.9 per 1,000 inhabitants, | 2021: 4.6 per 1,000 inhabitants, | 2022: 10.2 per 1,000 inhabitants, | 2023: 5.0 per 1,000 inhabitants, | 2024: 5.3 per 1,000 inhabitants, | 2025: 5.3 per 1,000 inhabitants, |
| Rank 13: | Netherlands, | 2019: 6.2 per 1,000 inhabitants, | 2020: 3.9 per 1,000 inhabitants, | 2021: 6.1 per 1,000 inhabitants, | 2022: 12.6 per 1,000 inhabitants, | 2023: 7.6 per 1,000 inhabitants, | 2024: 6.0 per 1,000 inhabitants, | 2025: 5.2 per 1,000 inhabitants, |
| Rank 14: | Italy, | 2019: 0.7 per 1,000 inhabitants, | 2020: −1.2 per 1,000 inhabitants, | 2021: 1.6 per 1,000 inhabitants, | 2022: 4.9 per 1,000 inhabitants, | 2023: 4.5 per 1,000 inhabitants, | 2024: 4.3 per 1,000 inhabitants, | 2025: 5.0 per 1,000 inhabitants, |
| Rank 15: | Croatia, | 2019: −4.9 per 1,000 inhabitants, | 2020: −4.9 per 1,000 inhabitants, | 2021: −1.2 per 1,000 inhabitants, | 2022: 3.0 per 1,000 inhabitants, | 2023: 7.8 per 1,000 inhabitants, | 2024: 8.1 per 1,000 inhabitants, | 2025: 4.9 per 1,000 inhabitants, |
| Rank 16: | Greece, | 2019: 1.7 per 1,000 inhabitants, | 2020: −1.0 per 1,000 inhabitants, | 2021: −3.3 per 1,000 inhabitants, | 2022: 0.4 per 1,000 inhabitants, | 2023: 2.9 per 1,000 inhabitants, | 2024: 5.2 per 1,000 inhabitants, | 2025: 4.8 per 1,000 inhabitants, |
| Rank 17: | Slovenia, | 2019: 7.8 per 1,000 inhabitants, | 2020: 8.7 per 1,000 inhabitants, | 2021: 1.2 per 1,000 inhabitants, | 2022: 6.9 per 1,000 inhabitants, | 2023: 5.4 per 1,000 inhabitants, | 2024: 5.4 per 1,000 inhabitants, | 2025: 4.0 per 1,000 inhabitants, |
| Rank 18: | Czechia, | 2019: 4.1 per 1,000 inhabitants, | 2020: 2.5 per 1,000 inhabitants, | 2021: 4.8 per 1,000 inhabitants, | 2022: 30.9 per 1,000 inhabitants, | 2023: 8.7 per 1,000 inhabitants, | 2024: 3.4 per 1,000 inhabitants, | 2025: 3.9 per 1,000 inhabitants, |
| Rank 19: | France, | 2019: 0.6 per 1,000 inhabitants, | 2020: 2.8 per 1,000 inhabitants, | 2021: 4.2 per 1,000 inhabitants, | 2022: 4.3 per 1,000 inhabitants, | 2023: 2.8 per 1,000 inhabitants, | 2024: 2.8 per 1,000 inhabitants, | 2025: 3.4 per 1,000 inhabitants, |
| Rank 20: | Austria, | 2019: 4.6 per 1,000 inhabitants, | 2020: 4.4 per 1,000 inhabitants, | 2021: 5.8 per 1,000 inhabitants, | 2022: 15.1 per 1,000 inhabitants, | 2023: 7.2 per 1,000 inhabitants, | 2024: 5.4 per 1,000 inhabitants, | 2025: 3.3 per 1,000 inhabitants, |
| Rank 21: | Germany, | 2019: 3.7 per 1,000 inhabitants, | 2020: 2.4 per 1,000 inhabitants, | 2021: 3.7 per 1,000 inhabitants, | 2022: 2.5 per 1,000 inhabitants, | 2023: 8.1 per 1,000 inhabitants, | 2024: 5.4 per 1,000 inhabitants, | 2025: 2.9 per 1,000 inhabitants, |
| Rank 22: | Sweden, | 2019: 7.0 per 1,000 inhabitants, | 2020: 3.5 per 1,000 inhabitants, | 2021: 4.9 per 1,000 inhabitants, | 2022: 5.6 per 1,000 inhabitants, | 2023: 2.3 per 1,000 inhabitants, | 2024: 2.7 per 1,000 inhabitants, | 2025: 1.2 per 1,000 inhabitants, |
| Rank 23: | Slovakia, | 2019: 0.7 per 1,000 inhabitants, | 2020: 0.8 per 1,000 inhabitants, | 2021: −1.5 per 1,000 inhabitants, | 2022: 0.2 per 1,000 inhabitants, | 2023: 0.3 per 1,000 inhabitants, | 2024: 0.4 per 1,000 inhabitants, | 2025: 0.3 per 1,000 inhabitants, |
| Rank 24: | Hungary, | 2019: 2.7 per 1,000 inhabitants, | 2020: 1.0 per 1,000 inhabitants, | 2021: 2.2 per 1,000 inhabitants, | 2022: 11.9 per 1,000 inhabitants, | 2023: 2.7 per 1,000 inhabitants, | 2024: 0.4 per 1,000 inhabitants, | 2025: 0.1 per 1,000 inhabitants, |
| Rank 24: | Poland, | 2019: 0.5 per 1,000 inhabitants, | 2020: −20.3 per 1,000 inhabitants, | 2021: 0.1 per 1,000 inhabitants, | 2022: 0.2 per 1,000 inhabitants, | 2023: 0.1 per 1,000 inhabitants, | 2024: 0.9 per 1,000 inhabitants, | 2025: 0.1 per 1,000 inhabitants, |
| Rank 26: | Latvia, | 2019: −1.8 per 1,000 inhabitants, | 2020: −1.7 per 1,000 inhabitants, | 2021: −0.2 per 1,000 inhabitants, | 2022: 16.5 per 1,000 inhabitants, | 2023: −1.7 per 1,000 inhabitants, | 2024: −2.3 per 1,000 inhabitants, | 2025: −0.7 per 1,000 inhabitants, |
| Rank 27: | Estonia, | 2019: 4.0 per 1,000 inhabitants, | 2020: 2.8 per 1,000 inhabitants, | 2021: 5.3 per 1,000 inhabitants, | 2022: 29.5 per 1,000 inhabitants, | 2023: 10.1 per 1,000 inhabitants, | 2024: 1.0 per 1,000 inhabitants, | 2025: −2.1 per 1,000 inhabitants, |
The regions of the EU
In 2024, among the EU's 244 regions, the crude rate of net migration plus statistical adjustment was highest in Voreio Aigaio (Greece), 43.6 per 1,000 inhabitants, and lowest in Guyane (France), a negative 14.7 per 1,000 inhabitants.
Crude rate of net migration plus statistical adjustment, by NUTS 2 region, per 1,000 inhabitants
2024 · the EU's 244 NUTS 2 regions- −14.7 (1 regions)
- −4.9 – −2.5 (3 regions)
- −2.4 – −0.1 (25 regions)
- 0.1–2.4 (40 regions)
- 2.5–4.9 (54 regions)
- 5.0–7.5 (61 regions)
- 7.6–43.6 (60 regions)
Zoom with two fingers, or with Ctrl and the scroll wheel or the buttons. Zoomed in, drag to move.
Austria5.4
- Wien10.1 per 1,000 inhabitants
- Niederösterreich5.4 per 1,000 inhabitants
- Burgenland5.2 per 1,000 inhabitants
- Kärnten4.5 per 1,000 inhabitants
- Steiermark4.1 per 1,000 inhabitants
- Oberösterreich3.9 per 1,000 inhabitants
- Vorarlberg3.7 per 1,000 inhabitants
- Salzburg3.0 per 1,000 inhabitants
- Tirol2.0 per 1,000 inhabitants
Belgium5.9
- Prov. Oost-Vlaanderen7.6 per 1,000 inhabitants
- Prov. West-Vlaanderen7.3 per 1,000 inhabitants
- Prov. Antwerpen6.9 per 1,000 inhabitants
- Prov. Limburg (BE)6.9 per 1,000 inhabitants
- Prov. Vlaams-Brabant6.6 per 1,000 inhabitants
- Prov. Hainaut5.5 per 1,000 inhabitants
- Prov. Liège5.5 per 1,000 inhabitants
- Prov. Namur4.4 per 1,000 inhabitants
- Prov. Brabant wallon4.2 per 1,000 inhabitants
- Prov. Luxembourg (BE)3.8 per 1,000 inhabitants
- Région de Bruxelles-Capitale/Brussels Hoofdstedelijk Gewest1.4 per 1,000 inhabitants
Bulgaria6.1
- Severoiztochen8.7 per 1,000 inhabitants
- Yuzhen tsentralen8.7 per 1,000 inhabitants
- Yugoiztochen7.2 per 1,000 inhabitants
- Yugozapaden6.4 per 1,000 inhabitants
- Severen tsentralen1.8 per 1,000 inhabitants
- Severozapaden−0.7 per 1,000 inhabitants
Croatia8.1
- Jadranska Hrvatska14.0 per 1,000 inhabitants
- Grad Zagreb9.0 per 1,000 inhabitants
- Sjeverna Hrvatska8.9 per 1,000 inhabitants
- Panonska Hrvatska−1.1 per 1,000 inhabitants
Cyprus13.9
- Kýpros13.9 per 1,000 inhabitants
Czechia3.4
- Praha9.2 per 1,000 inhabitants
- Střední Čechy8.9 per 1,000 inhabitants
- Jihovýchod3.4 per 1,000 inhabitants
- Jihozápad2.8 per 1,000 inhabitants
- Severovýchod1.4 per 1,000 inhabitants
- Střední Morava0.6 per 1,000 inhabitants
- Severozápad0.2 per 1,000 inhabitants
- Moravskoslezsko−1.3 per 1,000 inhabitants
Denmark5.3
- Hovedstaden7.5 per 1,000 inhabitants
- Sjælland5.7 per 1,000 inhabitants
- Midtjylland5.0 per 1,000 inhabitants
- Syddanmark3.5 per 1,000 inhabitants
- Nordjylland1.6 per 1,000 inhabitants
Estonia1.0
- Eesti1.0 per 1,000 inhabitants
Finland8.3
- Helsinki-Uusimaa11.5 per 1,000 inhabitants
- Länsi-Suomi8.3 per 1,000 inhabitants
- Etelä-Suomi8.0 per 1,000 inhabitants
- Åland6.7 per 1,000 inhabitants
- Pohjois- ja Itä-Suomi4.1 per 1,000 inhabitants
France2.8
- Corse12.3 per 1,000 inhabitants
- Aquitaine9.5 per 1,000 inhabitants
- Languedoc-Roussillon9.5 per 1,000 inhabitants
- Bretagne8.3 per 1,000 inhabitants
- Midi-Pyrénées7.5 per 1,000 inhabitants
- Provence-Alpes-Côte d’Azur6.9 per 1,000 inhabitants
- Poitou-Charentes6.4 per 1,000 inhabitants
- Limousin5.5 per 1,000 inhabitants
- Pays de la Loire5.2 per 1,000 inhabitants
- Basse-Normandie4.8 per 1,000 inhabitants
- Auvergne3.2 per 1,000 inhabitants
- Bourgogne3.2 per 1,000 inhabitants
- Rhône-Alpes3.2 per 1,000 inhabitants
- Centre — Val de Loire2.2 per 1,000 inhabitants
- Alsace2.0 per 1,000 inhabitants
- Mayotte2.0 per 1,000 inhabitants
- Haute-Normandie0.7 per 1,000 inhabitants
- La Réunion0.6 per 1,000 inhabitants
- Franche-Comté0.5 per 1,000 inhabitants
- Lorraine0.5 per 1,000 inhabitants
- Martinique0.2 per 1,000 inhabitants
- Nord-Pas de Calais−1.6 per 1,000 inhabitants
- Champagne-Ardenne−2.4 per 1,000 inhabitants
- Guadeloupe−2.4 per 1,000 inhabitants
- Picardie−2.4 per 1,000 inhabitants
- Ile de France−2.5 per 1,000 inhabitants
- Guyane−14.7 per 1,000 inhabitants
Germany5.4
- Niederbayern9.2 per 1,000 inhabitants
- Brandenburg8.8 per 1,000 inhabitants
- Oberbayern8.8 per 1,000 inhabitants
- Schwaben8.5 per 1,000 inhabitants
- Schleswig-Holstein7.9 per 1,000 inhabitants
- Oberpfalz7.5 per 1,000 inhabitants
- Berlin7.3 per 1,000 inhabitants
- Leipzig7.3 per 1,000 inhabitants
- Koblenz6.8 per 1,000 inhabitants
- Mecklenburg-Vorpommern6.6 per 1,000 inhabitants
- Hamburg6.5 per 1,000 inhabitants
- Unterfranken6.4 per 1,000 inhabitants
- Bremen6.2 per 1,000 inhabitants
- Sachsen-Anhalt5.9 per 1,000 inhabitants
- Darmstadt5.7 per 1,000 inhabitants
- Oberfranken5.6 per 1,000 inhabitants
- Mittelfranken5.5 per 1,000 inhabitants
- Düsseldorf5.3 per 1,000 inhabitants
- Lüneburg5.2 per 1,000 inhabitants
- Hannover5.1 per 1,000 inhabitants
- Saarland5.0 per 1,000 inhabitants
- Rheinhessen-Pfalz4.9 per 1,000 inhabitants
- Köln4.8 per 1,000 inhabitants
- Münster4.8 per 1,000 inhabitants
- Dresden4.7 per 1,000 inhabitants
- Kassel4.6 per 1,000 inhabitants
- Arnsberg4.5 per 1,000 inhabitants
- Freiburg4.4 per 1,000 inhabitants
- Karlsruhe3.8 per 1,000 inhabitants
- Braunschweig3.4 per 1,000 inhabitants
- Chemnitz3.4 per 1,000 inhabitants
- Weser-Ems3.4 per 1,000 inhabitants
- Detmold3.2 per 1,000 inhabitants
- Tübingen3.1 per 1,000 inhabitants
- Gießen3.0 per 1,000 inhabitants
- Trier2.5 per 1,000 inhabitants
- Stuttgart2.2 per 1,000 inhabitants
- Thüringen1.9 per 1,000 inhabitants
Greece5.2
- Voreio Aigaio43.6 per 1,000 inhabitants
- Ipeiros17.9 per 1,000 inhabitants
- Anatoliki Makedonia, Thraki14.5 per 1,000 inhabitants
- Sterea Elláda12.2 per 1,000 inhabitants
- Kentriki Makedonia4.8 per 1,000 inhabitants
- Thessalia4.6 per 1,000 inhabitants
- Peloponnisos4.5 per 1,000 inhabitants
- Notio Aigaio2.5 per 1,000 inhabitants
- Attiki2.4 per 1,000 inhabitants
- Dytiki Elláda2.1 per 1,000 inhabitants
- Kriti1.8 per 1,000 inhabitants
- Ionia Nisia−2.3 per 1,000 inhabitants
- Dytiki Makedonia−3.6 per 1,000 inhabitants
Hungary0.4
- Pest5.1 per 1,000 inhabitants
- Budapest4.1 per 1,000 inhabitants
- Dél-Alföld0.1 per 1,000 inhabitants
- Dél-Dunántúl−0.2 per 1,000 inhabitants
- Közép-Dunántúl−0.4 per 1,000 inhabitants
- Észak-Alföld−1.7 per 1,000 inhabitants
- Nyugat-Dunántúl−1.8 per 1,000 inhabitants
- Észak-Magyarország−4.9 per 1,000 inhabitants
Ireland13.1
- Southern16.4 per 1,000 inhabitants
- Eastern and Midland11.5 per 1,000 inhabitants
- Northern and Western11.3 per 1,000 inhabitants
Italy4.3
- Liguria9.1 per 1,000 inhabitants
- Emilia-Romagna7.3 per 1,000 inhabitants
- Piemonte6.7 per 1,000 inhabitants
- Lombardia6.0 per 1,000 inhabitants
- Toscana5.7 per 1,000 inhabitants
- Abruzzo5.6 per 1,000 inhabitants
- Friuli-Venezia Giulia5.4 per 1,000 inhabitants
- Provincia Autonoma di Trento5.3 per 1,000 inhabitants
- Umbria5.0 per 1,000 inhabitants
- Marche4.8 per 1,000 inhabitants
- Veneto4.5 per 1,000 inhabitants
- Provincia Autonoma di Bolzano/Bozen4.0 per 1,000 inhabitants
- Lazio3.8 per 1,000 inhabitants
- Valle d’Aosta/Vallée d’Aoste3.6 per 1,000 inhabitants
- Molise3.2 per 1,000 inhabitants
- Calabria2.3 per 1,000 inhabitants
- Sardegna2.2 per 1,000 inhabitants
- Sicilia1.9 per 1,000 inhabitants
- Puglia1.1 per 1,000 inhabitants
- Campania0.7 per 1,000 inhabitants
- Basilicata−0.1 per 1,000 inhabitants
Latvia−2.3
- Latvija−2.3 per 1,000 inhabitants
Lithuania8.0
- Sostinės regionas13.1 per 1,000 inhabitants
- Vidurio ir vakarų Lietuvos regionas5.8 per 1,000 inhabitants
Luxembourg11.7
- Luxembourg11.7 per 1,000 inhabitants
Malta18.7
- Malta18.7 per 1,000 inhabitants
Netherlands6.0
- Drenthe8.7 per 1,000 inhabitants
- Flevoland8.2 per 1,000 inhabitants
- Noord-Brabant8.1 per 1,000 inhabitants
- Gelderland6.6 per 1,000 inhabitants
- Zeeland6.4 per 1,000 inhabitants
- Overijssel6.2 per 1,000 inhabitants
- Limburg (NL)6.1 per 1,000 inhabitants
- Friesland (NL)5.7 per 1,000 inhabitants
- Zuid-Holland5.2 per 1,000 inhabitants
- Groningen4.9 per 1,000 inhabitants
- Noord-Holland4.5 per 1,000 inhabitants
- Utrecht4.3 per 1,000 inhabitants
Poland0.9
- Warszawski stołeczny7.1 per 1,000 inhabitants
- Pomorskie2.9 per 1,000 inhabitants
- Dolnośląskie2.5 per 1,000 inhabitants
- Małopolskie2.1 per 1,000 inhabitants
- Wielkopolskie1.3 per 1,000 inhabitants
- Lubuskie0.9 per 1,000 inhabitants
- Zachodniopomorskie0.8 per 1,000 inhabitants
- Łódzkie0.2 per 1,000 inhabitants
- Śląskie−0.2 per 1,000 inhabitants
- Opolskie−0.3 per 1,000 inhabitants
- Kujawsko-pomorskie−0.7 per 1,000 inhabitants
- Podlaskie−0.8 per 1,000 inhabitants
- Podkarpackie−1.0 per 1,000 inhabitants
- Warmińsko-mazurskie−1.8 per 1,000 inhabitants
- Mazowiecki regionalny−1.9 per 1,000 inhabitants
- Lubelskie−2.1 per 1,000 inhabitants
- Świętokrzyskie−2.4 per 1,000 inhabitants
Portugal19.2
- Península de Setúbal29.6 per 1,000 inhabitants
- Oeste e Vale do Tejo25.4 per 1,000 inhabitants
- Algarve25.3 per 1,000 inhabitants
- Grande Lisboa23.6 per 1,000 inhabitants
- Região Autónoma da Madeira18.9 per 1,000 inhabitants
- Centro (PT)17.4 per 1,000 inhabitants
- Alentejo15.6 per 1,000 inhabitants
- Norte13.6 per 1,000 inhabitants
- Região Autónoma dos Açores6.7 per 1,000 inhabitants
Romania4.0
- Bucureşti-Ilfov6.5 per 1,000 inhabitants
- Nord-Vest5.4 per 1,000 inhabitants
- Centru5.2 per 1,000 inhabitants
- Sud-Muntenia4.7 per 1,000 inhabitants
- Vest4.7 per 1,000 inhabitants
- Sud-Vest Oltenia3.0 per 1,000 inhabitants
- Nord-Est2.0 per 1,000 inhabitants
- Sud-Est1.2 per 1,000 inhabitants
Slovakia0.4
- Bratislavský kraj5.3 per 1,000 inhabitants
- Západné Slovensko0.8 per 1,000 inhabitants
- Stredné Slovensko−0.9 per 1,000 inhabitants
- Východné Slovensko−1.2 per 1,000 inhabitants
Slovenia5.4
- Zahodna Slovenija5.9 per 1,000 inhabitants
- Vzhodna Slovenija5.0 per 1,000 inhabitants
Spain12.8
- Comunitat Valenciana21.7 per 1,000 inhabitants
- Cataluña15.6 per 1,000 inhabitants
- Comunidad de Madrid14.6 per 1,000 inhabitants
- Illes Balears14.5 per 1,000 inhabitants
- Principado de Asturias13.9 per 1,000 inhabitants
- Aragón13.5 per 1,000 inhabitants
- Castilla-La Mancha13.0 per 1,000 inhabitants
- La Rioja11.9 per 1,000 inhabitants
- Canarias11.5 per 1,000 inhabitants
- Región de Murcia11.2 per 1,000 inhabitants
- País Vasco10.8 per 1,000 inhabitants
- Castilla y León10.7 per 1,000 inhabitants
- Galicia10.4 per 1,000 inhabitants
- Comunidad Foral de Navarra10.3 per 1,000 inhabitants
- Cantabria9.9 per 1,000 inhabitants
- Ciudad de Melilla8.3 per 1,000 inhabitants
- Andalucía6.7 per 1,000 inhabitants
- Extremadura3.4 per 1,000 inhabitants
- Ciudad de Ceuta2.7 per 1,000 inhabitants
Sweden2.7
- Övre Norrland7.3 per 1,000 inhabitants
- Sydsverige3.4 per 1,000 inhabitants
- Stockholm3.3 per 1,000 inhabitants
- Mellersta Norrland2.4 per 1,000 inhabitants
- Västsverige2.4 per 1,000 inhabitants
- Östra Mellansverige2.0 per 1,000 inhabitants
- Småland med öarna1.3 per 1,000 inhabitants
- Norra Mellansverige0.8 per 1,000 inhabitants
Natural change and total change
In 2025, the crude rate of natural change in the EU was a negative 3.0 per 1,000 inhabitants, and the crude rate of total population change 1.6 per 1,000 inhabitants.
Crude rates of natural change, net migration plus statistical adjustment and total population change, per 1,000 inhabitants
2025About the data
Net migration plus statistical adjustment in a year per 1,000 inhabitants of the year's average population. Net migration plus statistical adjustment is the change in a country's population during the year minus the births and plus the deaths of that year.
Eurostat: “Crude rate of net migration plus statistical adjustment is the ratio of net migration plus statistical adjustment during the year to the average population in that year. The value is expressed per 1 000 inhabitants.” (source)
Population figures, live births and deaths reported to Eurostat by the national statistical institutes under the EU regulation on demographic statistics. They come from population registers or from the latest census updated with later births, deaths and migration. Eurostat computes net migration as the difference between total population change and natural change.
How to read these numbers
How it is measured
Eurostat does not count migrants for this figure. It takes the change in a country's population over the year and removes the births and deaths. What is left is net migration plus a statistical adjustment. The adjustment can include corrections to the population figures and any other change that births, deaths, immigration and emigration do not explain. Errors in the population figures therefore pass into it.
Countries count different populations. Austria, Czechia, Denmark, Luxembourg, the Netherlands and Sweden report the registered population. Germany uses another definition. The other EU countries report the usually resident population, and Finland is listed under both the usually resident and the legally resident population. Belgium and Germany count births and deaths in the registered population, and France uses another definition for them.
While countries' revisions are being processed, the EU figure may not exactly match the sum of the countries.
France's figures include an adjustment by France's statistical institute. Population figures from 2016 on are not comparable with earlier ones after a change in the census questionnaire, and the adjustment allows a comparison over time. A second adjustment, introduced in 2026, covers the years from 2020 on, for changes in the census collection and the effects of the health crisis. Both are part of net migration plus statistical adjustment.
France's figures cover the whole country, with its overseas departments. Mayotte has been included since 2014.
Since 2016, Estonia has determined its usually resident population with a residency index, from signs of life in several registers. Its population figures include migration from 2012 on, and did not before.
A region's figure also counts people who moved to or from another region of the same country. A country's figure counts no moves between its own regions. The two are therefore different measures.
The regions of a country may not add up exactly to the country's figure. Some people and events cannot be placed in a region, and countries match their regional estimates to the national total in different ways. Some revisions after a census exist only for the country's figure.
Provisional figures
Provisional values (flag p) may still change. Eurostat publishes its first estimates of a year's population change in July of the following year, and countries may confirm or update them in its data collection in December. This concerns Belgium (2025), Cyprus (2025), France (2023–2025), Greece (2025), Italy (2025), the Netherlands (2025), Poland (2019), Romania (2025), Spain (2025) and the EU (2019, 2023–2025).
A provisional value (flag p) may still be revised. This concerns the regions of France (2024).
Revisions
Bulgaria, Germany, Ireland, Greece, Spain, Croatia, Italy, Cyprus, Lithuania, Hungary, Malta, Poland and Portugal revised their population figures between the 2011 and 2021 censuses. The revisions were published by the end of 2024. Net migration in this dataset is computed from these population figures.
Breaks in the series
Portugal's population estimates from 2022 come from administrative sources, and those up to 2021 are based on the censuses. Comparisons between a year up to 2021 and a year from 2022 are affected. Portugal sent revised figures for 2022 to 2025 in June 2026.
A break in the series (flag b) means that a value is not fully comparable with the years before it. This concerns Czechia (2021), Germany (2022–2023), Latvia (2023), Poland (2020–2021), Portugal (2022) and the EU (2020–2023).
Estimates
A value with flag e is an estimate, not measured or counted in full. This concerns Greece (2025), Poland (2019–2020), Romania (2019–2025), the regions of Romania (2024) and the EU (2019–2025).
Sources and data
Eurostat, Population change - Demographic balance and crude rates at national level (demo_gind). Data updated 27 October 2026, retrieved 6 November 2026. Licence: CC BY 4.0.
Eurostat metadata · Eurostat methodology
https://ec.europa.eu/eurostat/api/dissemination/statistics/1.0/data/demo_gind?format=JSON&lang=en&freq=A&geo=AT&geo=BE&geo=BG&geo=CY&geo=CZ&geo=DE&geo=DK&geo=EE&geo=EL&geo=ES&geo=EU27_2020&geo=FI&geo=FR&geo=HR&geo=HU&geo=IE&geo=IT&geo=LT&geo=LU&geo=LV&geo=MT&geo=NL&geo=PL&geo=PT&geo=RO&geo=SE&geo=SI&geo=SK&indic_de=CNMIGRATRTRelated stories
-
Foreign-born population in the EU countries
In Luxembourg, 51.03% of the population was born in another country, against 2.56% in Poland (2024)
-
Healthy life years in the EU countries
A newborn in Italy can expect 73.4 years of life without being limited in usual activities by a health problem, against 52.5 years in Latvia (2024)
-
Unmet needs for medical care in the EU
In Greece, 11.5% of people aged 16 or over went without medical care they needed because of the cost, the distance or a waiting list, against 0.1% in Cyprus and Malta (2025)
-
Excess mortality in the EU countries
11.1% fewer people died in Lithuania than on average in 2016–2019, and 18.0% more in Luxembourg (May 2026)