Housing costs as a share of income in the EU
Topic: Housing
In Greece, housing costs take 34.6% of disposable household income on average, against 10.9% in Cyprus.
In 2025, people in the EU lived in households whose housing costs took 18.9% of their disposable income on average. The income is that of the year before the survey.
- Figures for:
- 2025.
- Covers:
- the time of the survey.
- New data:
- once a year.
- Dataset updated:
- 20 October 2026.
Published 9 November 2026
The ranking
In 2025, the average share of housing costs in disposable household income was highest in Greece, at 34.6%, and lowest in Cyprus, at 10.9%.
Average share of housing costs in disposable household income, %
2025Above and below the at-risk-of-poverty threshold
Among people above the at-risk-of-poverty threshold, the gap between the highest and the lowest country was slightly narrower than among the whole population. Greece was again the highest, at 28.7%, and Croatia the lowest, at 8.0%. The gap between the highest and the lowest was 20.7 percentage points.
Among people at risk of poverty, the gap between the highest and the lowest country was much wider than among people above the at-risk-of-poverty threshold. Greece was again the highest, at 59.3%, and Cyprus the lowest, at 16.7%. The gap between Greece and Cyprus was 42.6 percentage points.
Average share of housing costs in disposable household income: above the threshold and at risk of poverty, %
2025| Everyone | Above the threshold | At risk of poverty | |
|---|---|---|---|
| Lowest | 10.9%Cyprus | 8.0%Croatia | 16.7%Cyprus |
| Highest | 34.6%Greece | 28.7%Greece | 59.3%Greece |
| Highest − lowest | 23.7 pp | 20.7 pp | 42.6 pp |
Household types
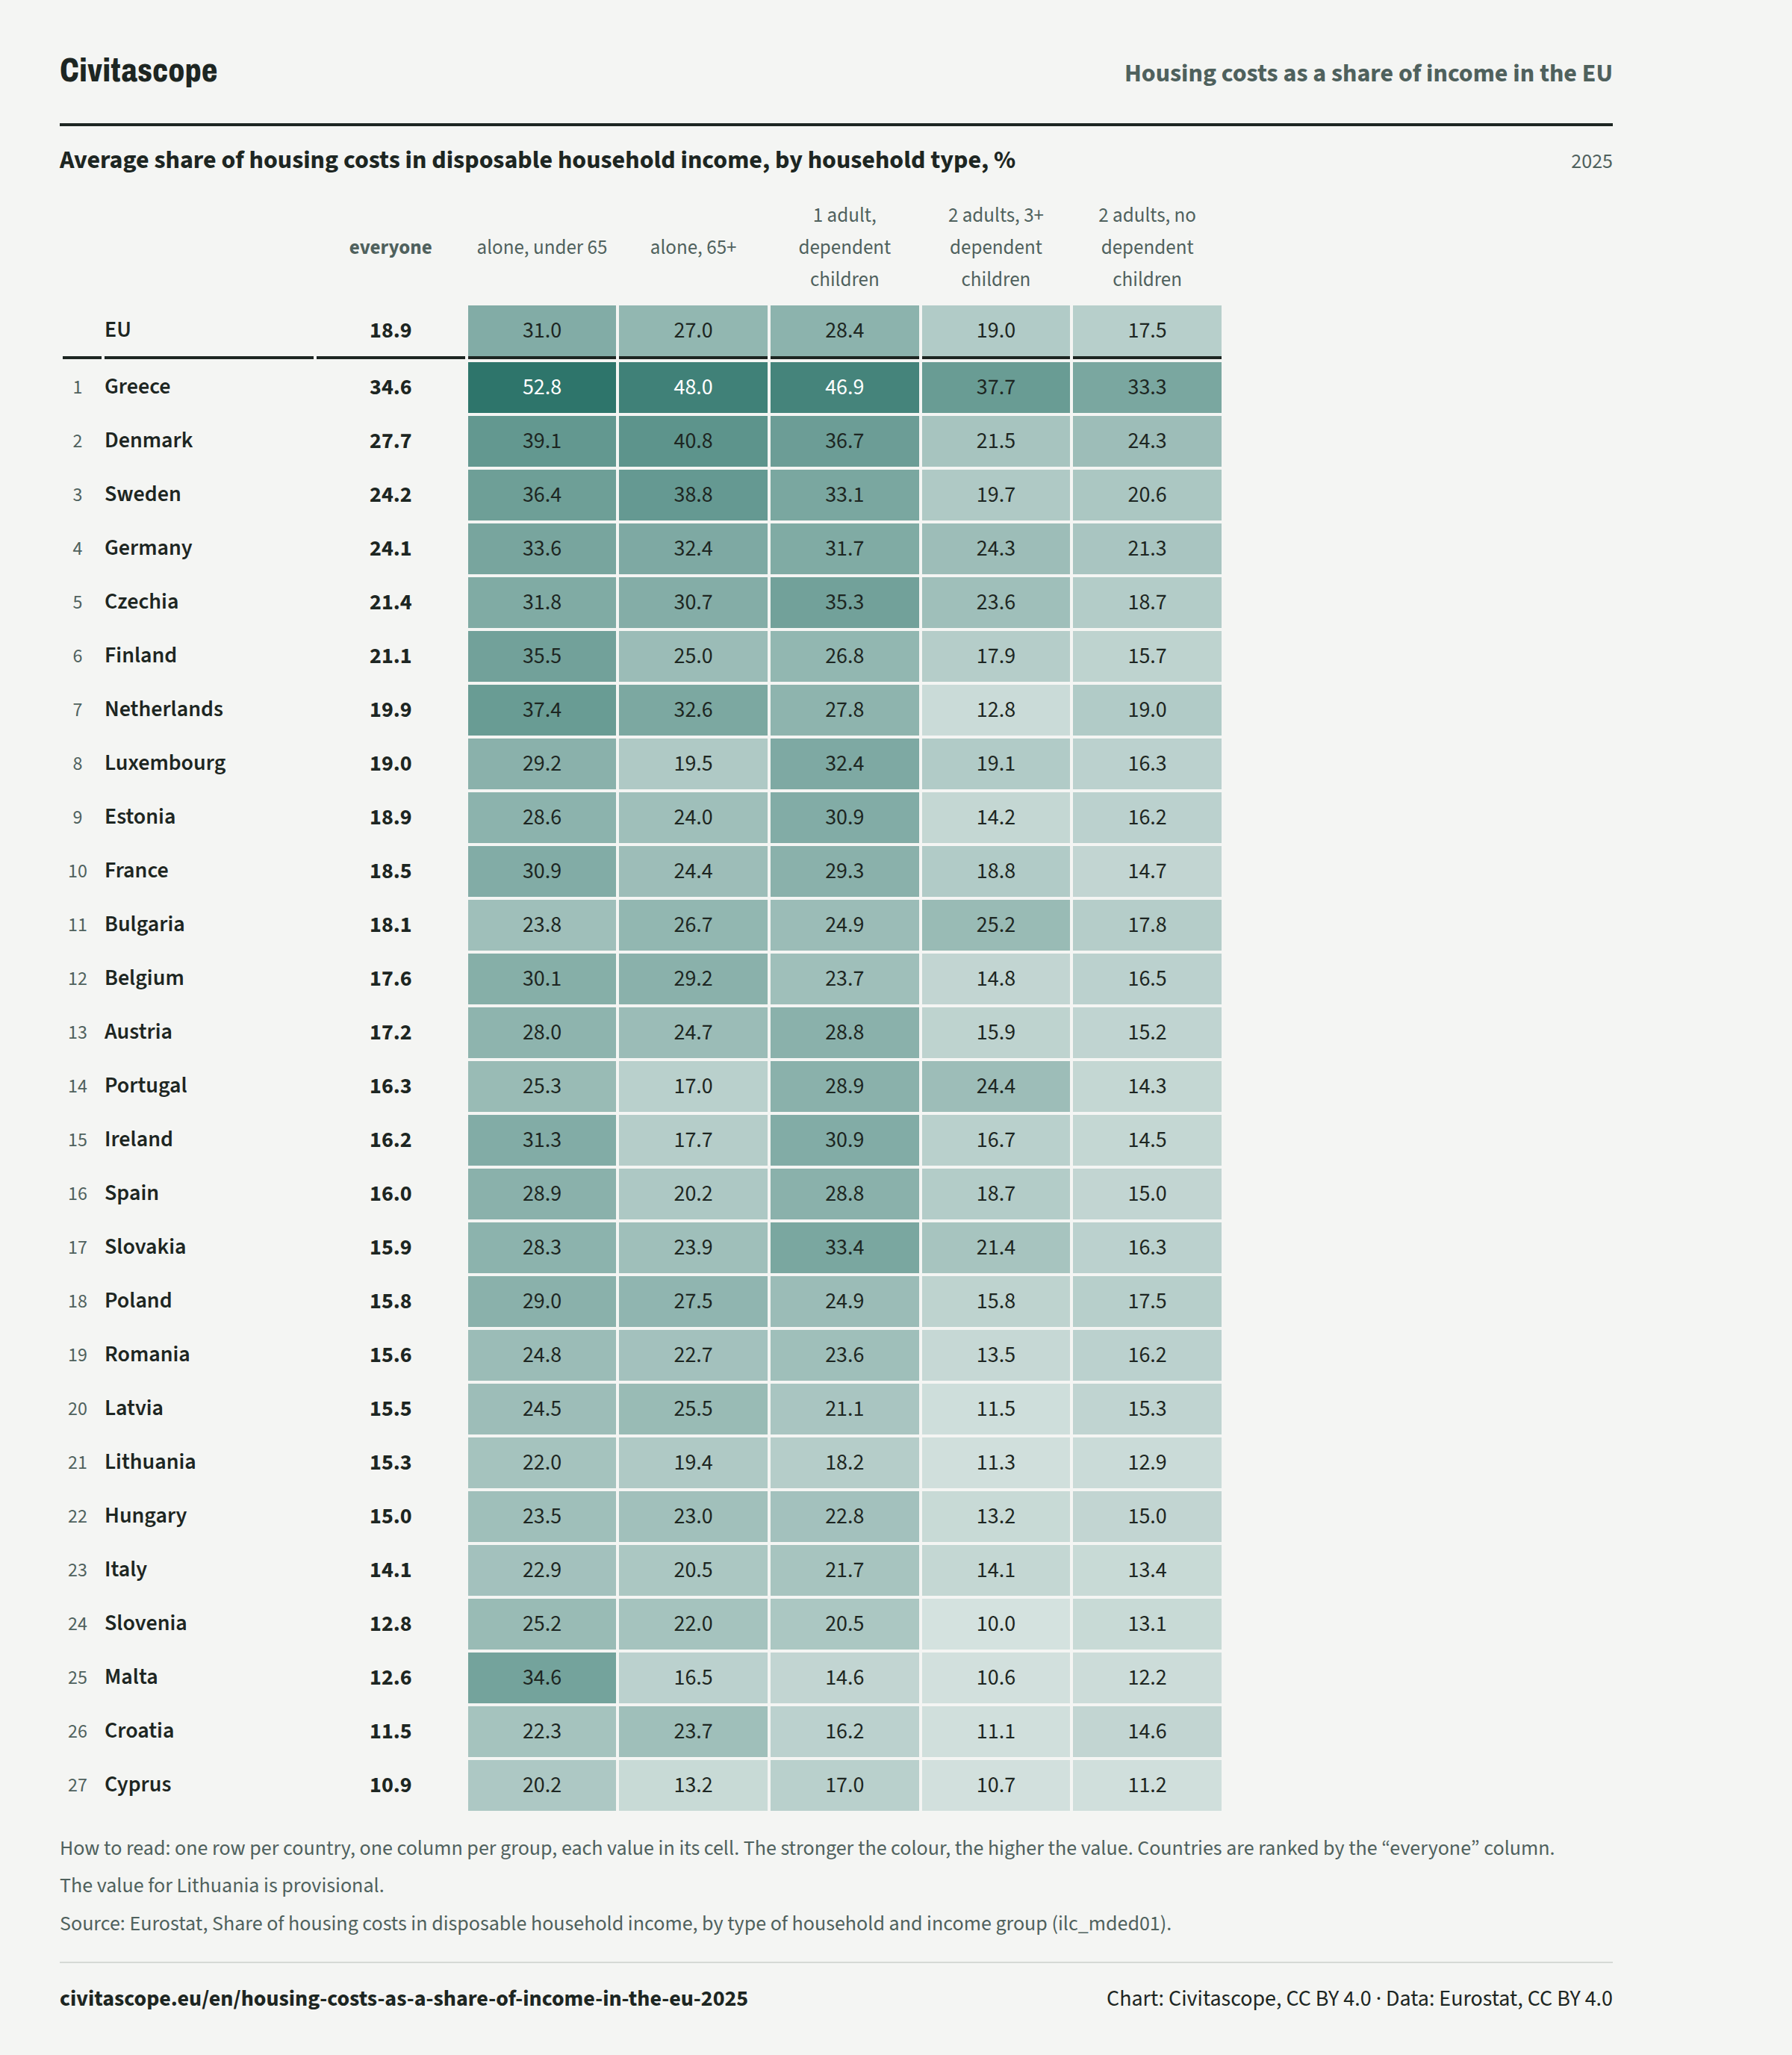
In 2025, housing costs took 31.0% of disposable income on average for people in the EU living alone under 65, against 17.5% for people in households of two adults without dependent children.
Average share of housing costs in disposable household income, by household type, %
2025| everyone | alone, under 65 | alone, 65+ | 1 adult, dependent children | 2 adults, 3+ dependent children | 2 adults, no dependent children | ||
|---|---|---|---|---|---|---|---|
| EU, | everyone: 18.9%, | alone, under 65: 31.0%, | alone, 65+: 27.0%, | 1 adult, dependent children: 28.4%, | 2 adults, 3+ dependent children: 19.0%, | 2 adults, no dependent children: 17.5%, | |
| Rank 1: | Greece, | everyone: 34.6%, | alone, under 65: 52.8%, | alone, 65+: 48.0%, | 1 adult, dependent children: 46.9%, | 2 adults, 3+ dependent children: 37.7%, | 2 adults, no dependent children: 33.3%, |
| Rank 2: | Denmark, | everyone: 27.7%, | alone, under 65: 39.1%, | alone, 65+: 40.8%, | 1 adult, dependent children: 36.7%, | 2 adults, 3+ dependent children: 21.5%, | 2 adults, no dependent children: 24.3%, |
| Rank 3: | Sweden, | everyone: 24.2%, | alone, under 65: 36.4%, | alone, 65+: 38.8%, | 1 adult, dependent children: 33.1%, | 2 adults, 3+ dependent children: 19.7%, | 2 adults, no dependent children: 20.6%, |
| Rank 4: | Germany, | everyone: 24.1%, | alone, under 65: 33.6%, | alone, 65+: 32.4%, | 1 adult, dependent children: 31.7%, | 2 adults, 3+ dependent children: 24.3%, | 2 adults, no dependent children: 21.3%, |
| Rank 5: | Czechia, | everyone: 21.4%, | alone, under 65: 31.8%, | alone, 65+: 30.7%, | 1 adult, dependent children: 35.3%, | 2 adults, 3+ dependent children: 23.6%, | 2 adults, no dependent children: 18.7%, |
| Rank 6: | Finland, | everyone: 21.1%, | alone, under 65: 35.5%, | alone, 65+: 25.0%, | 1 adult, dependent children: 26.8%, | 2 adults, 3+ dependent children: 17.9%, | 2 adults, no dependent children: 15.7%, |
| Rank 7: | Netherlands, | everyone: 19.9%, | alone, under 65: 37.4%, | alone, 65+: 32.6%, | 1 adult, dependent children: 27.8%, | 2 adults, 3+ dependent children: 12.8%, | 2 adults, no dependent children: 19.0%, |
| Rank 8: | Luxembourg, | everyone: 19.0%, | alone, under 65: 29.2%, | alone, 65+: 19.5%, | 1 adult, dependent children: 32.4%, | 2 adults, 3+ dependent children: 19.1%, | 2 adults, no dependent children: 16.3%, |
| Rank 9: | Estonia, | everyone: 18.9%, | alone, under 65: 28.6%, | alone, 65+: 24.0%, | 1 adult, dependent children: 30.9%, | 2 adults, 3+ dependent children: 14.2%, | 2 adults, no dependent children: 16.2%, |
| Rank 10: | France, | everyone: 18.5%, | alone, under 65: 30.9%, | alone, 65+: 24.4%, | 1 adult, dependent children: 29.3%, | 2 adults, 3+ dependent children: 18.8%, | 2 adults, no dependent children: 14.7%, |
| Rank 11: | Bulgaria, | everyone: 18.1%, | alone, under 65: 23.8%, | alone, 65+: 26.7%, | 1 adult, dependent children: 24.9%, | 2 adults, 3+ dependent children: 25.2%, | 2 adults, no dependent children: 17.8%, |
| Rank 12: | Belgium, | everyone: 17.6%, | alone, under 65: 30.1%, | alone, 65+: 29.2%, | 1 adult, dependent children: 23.7%, | 2 adults, 3+ dependent children: 14.8%, | 2 adults, no dependent children: 16.5%, |
| Rank 13: | Austria, | everyone: 17.2%, | alone, under 65: 28.0%, | alone, 65+: 24.7%, | 1 adult, dependent children: 28.8%, | 2 adults, 3+ dependent children: 15.9%, | 2 adults, no dependent children: 15.2%, |
| Rank 14: | Portugal, | everyone: 16.3%, | alone, under 65: 25.3%, | alone, 65+: 17.0%, | 1 adult, dependent children: 28.9%, | 2 adults, 3+ dependent children: 24.4%, | 2 adults, no dependent children: 14.3%, |
| Rank 15: | Ireland, | everyone: 16.2%, | alone, under 65: 31.3%, | alone, 65+: 17.7%, | 1 adult, dependent children: 30.9%, | 2 adults, 3+ dependent children: 16.7%, | 2 adults, no dependent children: 14.5%, |
| Rank 16: | Spain, | everyone: 16.0%, | alone, under 65: 28.9%, | alone, 65+: 20.2%, | 1 adult, dependent children: 28.8%, | 2 adults, 3+ dependent children: 18.7%, | 2 adults, no dependent children: 15.0%, |
| Rank 17: | Slovakia, | everyone: 15.9%, | alone, under 65: 28.3%, | alone, 65+: 23.9%, | 1 adult, dependent children: 33.4%, | 2 adults, 3+ dependent children: 21.4%, | 2 adults, no dependent children: 16.3%, |
| Rank 18: | Poland, | everyone: 15.8%, | alone, under 65: 29.0%, | alone, 65+: 27.5%, | 1 adult, dependent children: 24.9%, | 2 adults, 3+ dependent children: 15.8%, | 2 adults, no dependent children: 17.5%, |
| Rank 19: | Romania, | everyone: 15.6%, | alone, under 65: 24.8%, | alone, 65+: 22.7%, | 1 adult, dependent children: 23.6%, | 2 adults, 3+ dependent children: 13.5%, | 2 adults, no dependent children: 16.2%, |
| Rank 20: | Latvia, | everyone: 15.5%, | alone, under 65: 24.5%, | alone, 65+: 25.5%, | 1 adult, dependent children: 21.1%, | 2 adults, 3+ dependent children: 11.5%, | 2 adults, no dependent children: 15.3%, |
| Rank 21: | Lithuania, | everyone: 15.3%, | alone, under 65: 22.0%, | alone, 65+: 19.4%, | 1 adult, dependent children: 18.2%, | 2 adults, 3+ dependent children: 11.3%, | 2 adults, no dependent children: 12.9%, |
| Rank 22: | Hungary, | everyone: 15.0%, | alone, under 65: 23.5%, | alone, 65+: 23.0%, | 1 adult, dependent children: 22.8%, | 2 adults, 3+ dependent children: 13.2%, | 2 adults, no dependent children: 15.0%, |
| Rank 23: | Italy, | everyone: 14.1%, | alone, under 65: 22.9%, | alone, 65+: 20.5%, | 1 adult, dependent children: 21.7%, | 2 adults, 3+ dependent children: 14.1%, | 2 adults, no dependent children: 13.4%, |
| Rank 24: | Slovenia, | everyone: 12.8%, | alone, under 65: 25.2%, | alone, 65+: 22.0%, | 1 adult, dependent children: 20.5%, | 2 adults, 3+ dependent children: 10.0%, | 2 adults, no dependent children: 13.1%, |
| Rank 25: | Malta, | everyone: 12.6%, | alone, under 65: 34.6%, | alone, 65+: 16.5%, | 1 adult, dependent children: 14.6%, | 2 adults, 3+ dependent children: 10.6%, | 2 adults, no dependent children: 12.2%, |
| Rank 26: | Croatia, | everyone: 11.5%, | alone, under 65: 22.3%, | alone, 65+: 23.7%, | 1 adult, dependent children: 16.2%, | 2 adults, 3+ dependent children: 11.1%, | 2 adults, no dependent children: 14.6%, |
| Rank 27: | Cyprus, | everyone: 10.9%, | alone, under 65: 20.2%, | alone, 65+: 13.2%, | 1 adult, dependent children: 17.0%, | 2 adults, 3+ dependent children: 10.7%, | 2 adults, no dependent children: 11.2%, |
| everyone | alone, under 65 | alone, 65+ | 1 adult, dependent children | ||
|---|---|---|---|---|---|
| EU, | everyone: 18.9%, | alone, under 65: 31.0%, | alone, 65+: 27.0%, | 1 adult, dependent children: 28.4%, | |
| Rank 1: | Greece, | everyone: 34.6%, | alone, under 65: 52.8%, | alone, 65+: 48.0%, | 1 adult, dependent children: 46.9%, |
| Rank 2: | Denmark, | everyone: 27.7%, | alone, under 65: 39.1%, | alone, 65+: 40.8%, | 1 adult, dependent children: 36.7%, |
| Rank 3: | Sweden, | everyone: 24.2%, | alone, under 65: 36.4%, | alone, 65+: 38.8%, | 1 adult, dependent children: 33.1%, |
| Rank 4: | Germany, | everyone: 24.1%, | alone, under 65: 33.6%, | alone, 65+: 32.4%, | 1 adult, dependent children: 31.7%, |
| Rank 5: | Czechia, | everyone: 21.4%, | alone, under 65: 31.8%, | alone, 65+: 30.7%, | 1 adult, dependent children: 35.3%, |
| Rank 6: | Finland, | everyone: 21.1%, | alone, under 65: 35.5%, | alone, 65+: 25.0%, | 1 adult, dependent children: 26.8%, |
| Rank 7: | Netherlands, | everyone: 19.9%, | alone, under 65: 37.4%, | alone, 65+: 32.6%, | 1 adult, dependent children: 27.8%, |
| Rank 8: | Luxembourg, | everyone: 19.0%, | alone, under 65: 29.2%, | alone, 65+: 19.5%, | 1 adult, dependent children: 32.4%, |
| Rank 9: | Estonia, | everyone: 18.9%, | alone, under 65: 28.6%, | alone, 65+: 24.0%, | 1 adult, dependent children: 30.9%, |
| Rank 10: | France, | everyone: 18.5%, | alone, under 65: 30.9%, | alone, 65+: 24.4%, | 1 adult, dependent children: 29.3%, |
| Rank 11: | Bulgaria, | everyone: 18.1%, | alone, under 65: 23.8%, | alone, 65+: 26.7%, | 1 adult, dependent children: 24.9%, |
| Rank 12: | Belgium, | everyone: 17.6%, | alone, under 65: 30.1%, | alone, 65+: 29.2%, | 1 adult, dependent children: 23.7%, |
| Rank 13: | Austria, | everyone: 17.2%, | alone, under 65: 28.0%, | alone, 65+: 24.7%, | 1 adult, dependent children: 28.8%, |
| Rank 14: | Portugal, | everyone: 16.3%, | alone, under 65: 25.3%, | alone, 65+: 17.0%, | 1 adult, dependent children: 28.9%, |
| Rank 15: | Ireland, | everyone: 16.2%, | alone, under 65: 31.3%, | alone, 65+: 17.7%, | 1 adult, dependent children: 30.9%, |
| Rank 16: | Spain, | everyone: 16.0%, | alone, under 65: 28.9%, | alone, 65+: 20.2%, | 1 adult, dependent children: 28.8%, |
| Rank 17: | Slovakia, | everyone: 15.9%, | alone, under 65: 28.3%, | alone, 65+: 23.9%, | 1 adult, dependent children: 33.4%, |
| Rank 18: | Poland, | everyone: 15.8%, | alone, under 65: 29.0%, | alone, 65+: 27.5%, | 1 adult, dependent children: 24.9%, |
| Rank 19: | Romania, | everyone: 15.6%, | alone, under 65: 24.8%, | alone, 65+: 22.7%, | 1 adult, dependent children: 23.6%, |
| Rank 20: | Latvia, | everyone: 15.5%, | alone, under 65: 24.5%, | alone, 65+: 25.5%, | 1 adult, dependent children: 21.1%, |
| Rank 21: | Lithuania, | everyone: 15.3%, | alone, under 65: 22.0%, | alone, 65+: 19.4%, | 1 adult, dependent children: 18.2%, |
| Rank 22: | Hungary, | everyone: 15.0%, | alone, under 65: 23.5%, | alone, 65+: 23.0%, | 1 adult, dependent children: 22.8%, |
| Rank 23: | Italy, | everyone: 14.1%, | alone, under 65: 22.9%, | alone, 65+: 20.5%, | 1 adult, dependent children: 21.7%, |
| Rank 24: | Slovenia, | everyone: 12.8%, | alone, under 65: 25.2%, | alone, 65+: 22.0%, | 1 adult, dependent children: 20.5%, |
| Rank 25: | Malta, | everyone: 12.6%, | alone, under 65: 34.6%, | alone, 65+: 16.5%, | 1 adult, dependent children: 14.6%, |
| Rank 26: | Croatia, | everyone: 11.5%, | alone, under 65: 22.3%, | alone, 65+: 23.7%, | 1 adult, dependent children: 16.2%, |
| Rank 27: | Cyprus, | everyone: 10.9%, | alone, under 65: 20.2%, | alone, 65+: 13.2%, | 1 adult, dependent children: 17.0%, |
| everyone | 2 adults, 3+ dependent children | 2 adults, no dependent children | ||
|---|---|---|---|---|
| EU, | everyone: 18.9%, | 2 adults, 3+ dependent children: 19.0%, | 2 adults, no dependent children: 17.5%, | |
| Rank 1: | Greece, | everyone: 34.6%, | 2 adults, 3+ dependent children: 37.7%, | 2 adults, no dependent children: 33.3%, |
| Rank 2: | Denmark, | everyone: 27.7%, | 2 adults, 3+ dependent children: 21.5%, | 2 adults, no dependent children: 24.3%, |
| Rank 3: | Sweden, | everyone: 24.2%, | 2 adults, 3+ dependent children: 19.7%, | 2 adults, no dependent children: 20.6%, |
| Rank 4: | Germany, | everyone: 24.1%, | 2 adults, 3+ dependent children: 24.3%, | 2 adults, no dependent children: 21.3%, |
| Rank 5: | Czechia, | everyone: 21.4%, | 2 adults, 3+ dependent children: 23.6%, | 2 adults, no dependent children: 18.7%, |
| Rank 6: | Finland, | everyone: 21.1%, | 2 adults, 3+ dependent children: 17.9%, | 2 adults, no dependent children: 15.7%, |
| Rank 7: | Netherlands, | everyone: 19.9%, | 2 adults, 3+ dependent children: 12.8%, | 2 adults, no dependent children: 19.0%, |
| Rank 8: | Luxembourg, | everyone: 19.0%, | 2 adults, 3+ dependent children: 19.1%, | 2 adults, no dependent children: 16.3%, |
| Rank 9: | Estonia, | everyone: 18.9%, | 2 adults, 3+ dependent children: 14.2%, | 2 adults, no dependent children: 16.2%, |
| Rank 10: | France, | everyone: 18.5%, | 2 adults, 3+ dependent children: 18.8%, | 2 adults, no dependent children: 14.7%, |
| Rank 11: | Bulgaria, | everyone: 18.1%, | 2 adults, 3+ dependent children: 25.2%, | 2 adults, no dependent children: 17.8%, |
| Rank 12: | Belgium, | everyone: 17.6%, | 2 adults, 3+ dependent children: 14.8%, | 2 adults, no dependent children: 16.5%, |
| Rank 13: | Austria, | everyone: 17.2%, | 2 adults, 3+ dependent children: 15.9%, | 2 adults, no dependent children: 15.2%, |
| Rank 14: | Portugal, | everyone: 16.3%, | 2 adults, 3+ dependent children: 24.4%, | 2 adults, no dependent children: 14.3%, |
| Rank 15: | Ireland, | everyone: 16.2%, | 2 adults, 3+ dependent children: 16.7%, | 2 adults, no dependent children: 14.5%, |
| Rank 16: | Spain, | everyone: 16.0%, | 2 adults, 3+ dependent children: 18.7%, | 2 adults, no dependent children: 15.0%, |
| Rank 17: | Slovakia, | everyone: 15.9%, | 2 adults, 3+ dependent children: 21.4%, | 2 adults, no dependent children: 16.3%, |
| Rank 18: | Poland, | everyone: 15.8%, | 2 adults, 3+ dependent children: 15.8%, | 2 adults, no dependent children: 17.5%, |
| Rank 19: | Romania, | everyone: 15.6%, | 2 adults, 3+ dependent children: 13.5%, | 2 adults, no dependent children: 16.2%, |
| Rank 20: | Latvia, | everyone: 15.5%, | 2 adults, 3+ dependent children: 11.5%, | 2 adults, no dependent children: 15.3%, |
| Rank 21: | Lithuania, | everyone: 15.3%, | 2 adults, 3+ dependent children: 11.3%, | 2 adults, no dependent children: 12.9%, |
| Rank 22: | Hungary, | everyone: 15.0%, | 2 adults, 3+ dependent children: 13.2%, | 2 adults, no dependent children: 15.0%, |
| Rank 23: | Italy, | everyone: 14.1%, | 2 adults, 3+ dependent children: 14.1%, | 2 adults, no dependent children: 13.4%, |
| Rank 24: | Slovenia, | everyone: 12.8%, | 2 adults, 3+ dependent children: 10.0%, | 2 adults, no dependent children: 13.1%, |
| Rank 25: | Malta, | everyone: 12.6%, | 2 adults, 3+ dependent children: 10.6%, | 2 adults, no dependent children: 12.2%, |
| Rank 26: | Croatia, | everyone: 11.5%, | 2 adults, 3+ dependent children: 11.1%, | 2 adults, no dependent children: 14.6%, |
| Rank 27: | Cyprus, | everyone: 10.9%, | 2 adults, 3+ dependent children: 10.7%, | 2 adults, no dependent children: 11.2%, |
About the data
The average, over people living in private households, of the share that their household's total housing costs take of its disposable income.
Eurostat: “The share of housing costs in disposable household income refers to the weighted mean of the distribution of the share of housing costs (HH070) in disposable household income (HY020).” (source)
EU statistics on income and living conditions (EU-SILC), a yearly sample survey of households run by the national statistical institutes, combined in many countries with administrative data.
How to read these numbers
How it is measured
The survey covers people living in private households. People in collective households and institutions are generally not included.
The figure is an average of each household's share, counted once for every person living in it. It is not the share of all housing costs in all income.
Housing costs include rent or mortgage interest on the main dwelling, utilities such as water, electricity, gas and heating, mandatory charges, regular maintenance and repairs, and taxes. Mortgage principal repayments are not included. Housing benefits are not deducted from the costs.
The income in the share is the household's income of the calendar year before the survey. The housing costs are those of the survey year.
France's figures cover the European part of the country and, since 2022, four overseas departments (Guadeloupe, Martinique, French Guiana and Réunion). Mayotte is not included. Portugal's figures include the Azores and Madeira. Cyprus's figures cover only the areas controlled by the government of the Republic of Cyprus.
Provisional figures
A provisional value (flag p) may still be revised. This concerns Lithuania (2025).
Sources and data
Eurostat, Share of housing costs in disposable household income, by type of household and income group (ilc_mded01). Data updated 20 October 2026, retrieved 9 November 2026. Licence: CC BY 4.0.
Eurostat metadata · Eurostat methodology
https://ec.europa.eu/eurostat/api/dissemination/statistics/1.0/data/ilc_mded01?format=JSON&lang=en&freq=A&geo=AT&geo=BE&geo=BG&geo=CY&geo=CZ&geo=DE&geo=DK&geo=EE&geo=EL&geo=ES&geo=EU27_2020&geo=FI&geo=FR&geo=HR&geo=HU&geo=IE&geo=IT&geo=LT&geo=LU&geo=LV&geo=MT&geo=NL&geo=PL&geo=PT&geo=RO&geo=SE&geo=SI&geo=SK&hhcomp=TOTAL&rskpovth=TOTAL&unit=PCRelated stories
-
How fast house prices rose in the EU countries
House prices rose by 18.3% in Hungary and fell by 2.3% in Finland (2025)
-
Who owns their home and who rents in the EU
In Slovakia, 93.8% of people live in a home their household owns, against 47.2% in Germany (2025)
-
Housing costs over 40% of income in the EU countries
In Greece, 26.4% of people live in households that spend more than 40% of their income on housing, against 2.4% in Cyprus (2025)
-
Overcrowded homes in the EU countries
40.4% of people in Romania live in an overcrowded home, against 2.2% in Cyprus (2025)