How fast house prices rose in the EU countries
Topic: Housing
House prices rose by 18.3% in Hungary and fell by 2.3% in Finland.
In 2025, house prices in the EU rose by 5.5% compared with the year before. The house price index follows the prices of dwellings bought by households.
- Figures for:
- 2025.
- Covers:
- the whole year.
- New data:
- once a year.
- Dataset updated:
- 1 October 2026.
Published 6 November 2026
The ranking
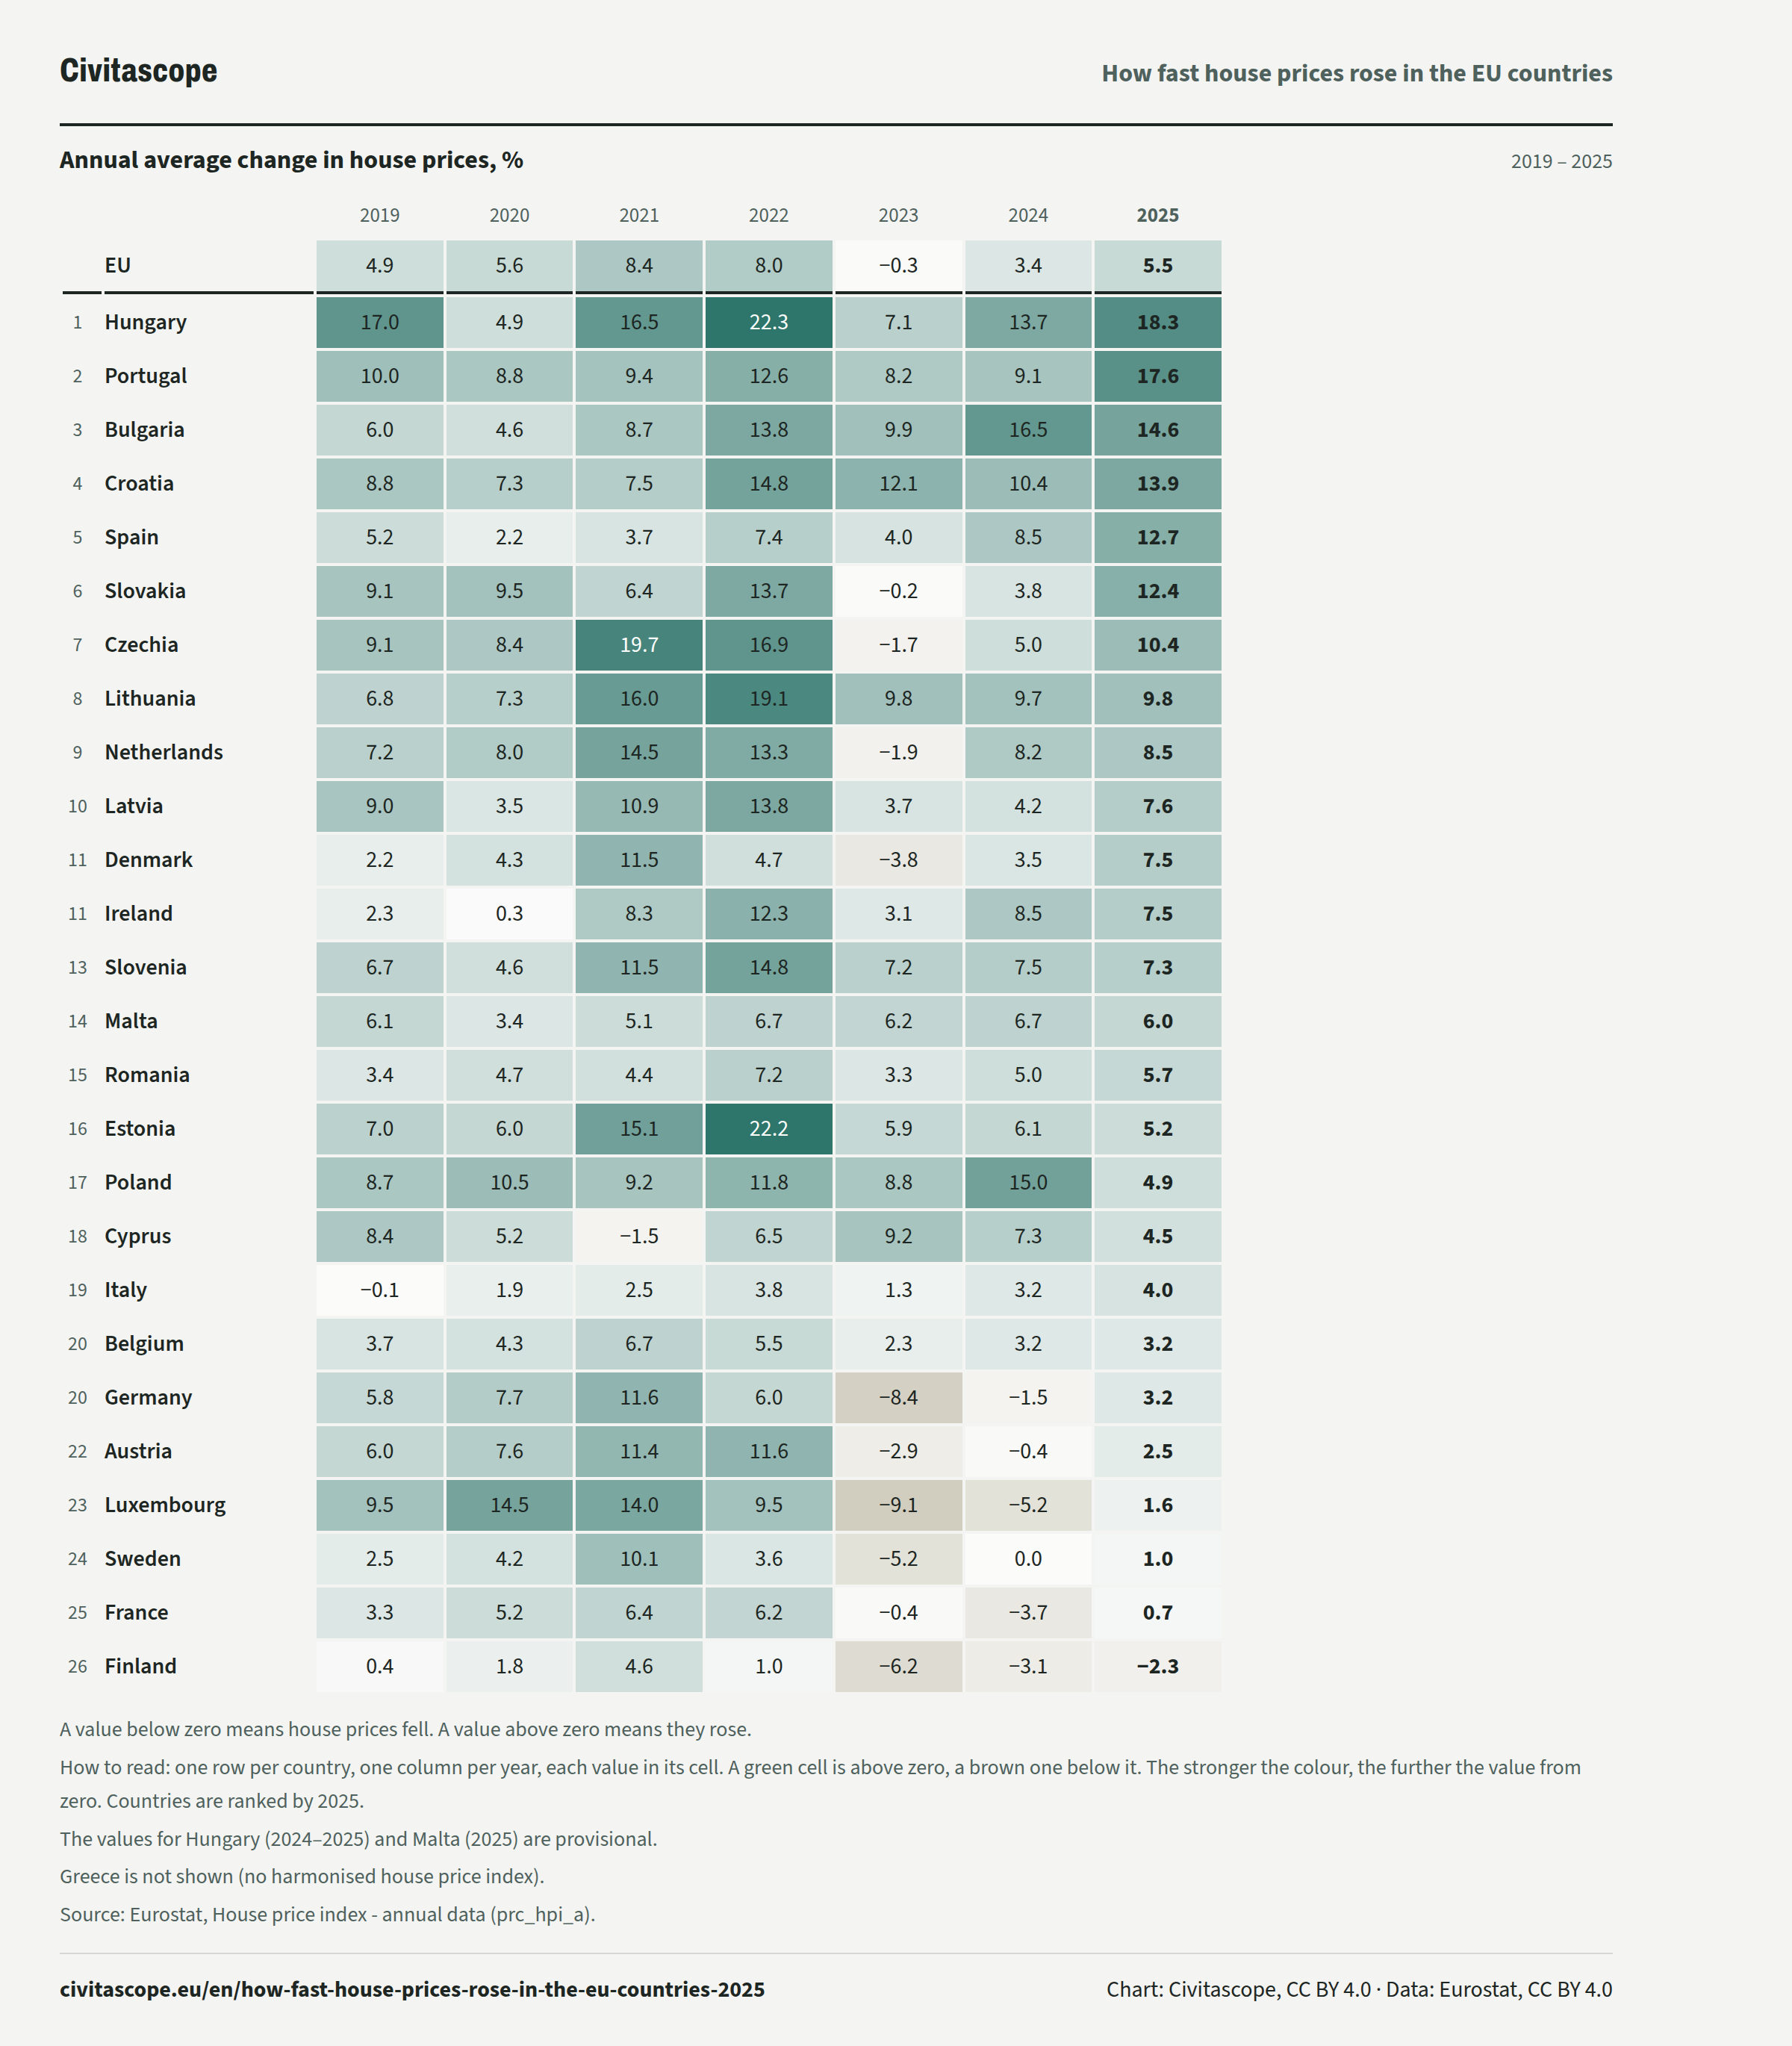
In 2025, the change was highest in Hungary, where house prices rose by 18.3%, and lowest in Finland, where they fell by 2.3%.
Annual average change in house prices, %
2025Year by year
Annual average change in house prices, %
2019 – 2025| 2019 | 2020 | 2021 | 2022 | 2023 | 2024 | 2025 | ||
|---|---|---|---|---|---|---|---|---|
| EU, | 2019: 4.9 %, | 2020: 5.6 %, | 2021: 8.4 %, | 2022: 8.0 %, | 2023: −0.3 %, | 2024: 3.4 %, | 2025: 5.5 %, | |
| Rank 1: | Hungary, | 2019: 17.0 %, | 2020: 4.9 %, | 2021: 16.5 %, | 2022: 22.3 %, | 2023: 7.1 %, | 2024: 13.7 %, | 2025: 18.3 %, |
| Rank 2: | Portugal, | 2019: 10.0 %, | 2020: 8.8 %, | 2021: 9.4 %, | 2022: 12.6 %, | 2023: 8.2 %, | 2024: 9.1 %, | 2025: 17.6 %, |
| Rank 3: | Bulgaria, | 2019: 6.0 %, | 2020: 4.6 %, | 2021: 8.7 %, | 2022: 13.8 %, | 2023: 9.9 %, | 2024: 16.5 %, | 2025: 14.6 %, |
| Rank 4: | Croatia, | 2019: 8.8 %, | 2020: 7.3 %, | 2021: 7.5 %, | 2022: 14.8 %, | 2023: 12.1 %, | 2024: 10.4 %, | 2025: 13.9 %, |
| Rank 5: | Spain, | 2019: 5.2 %, | 2020: 2.2 %, | 2021: 3.7 %, | 2022: 7.4 %, | 2023: 4.0 %, | 2024: 8.5 %, | 2025: 12.7 %, |
| Rank 6: | Slovakia, | 2019: 9.1 %, | 2020: 9.5 %, | 2021: 6.4 %, | 2022: 13.7 %, | 2023: −0.2 %, | 2024: 3.8 %, | 2025: 12.4 %, |
| Rank 7: | Czechia, | 2019: 9.1 %, | 2020: 8.4 %, | 2021: 19.7 %, | 2022: 16.9 %, | 2023: −1.7 %, | 2024: 5.0 %, | 2025: 10.4 %, |
| Rank 8: | Lithuania, | 2019: 6.8 %, | 2020: 7.3 %, | 2021: 16.0 %, | 2022: 19.1 %, | 2023: 9.8 %, | 2024: 9.7 %, | 2025: 9.8 %, |
| Rank 9: | Netherlands, | 2019: 7.2 %, | 2020: 8.0 %, | 2021: 14.5 %, | 2022: 13.3 %, | 2023: −1.9 %, | 2024: 8.2 %, | 2025: 8.5 %, |
| Rank 10: | Latvia, | 2019: 9.0 %, | 2020: 3.5 %, | 2021: 10.9 %, | 2022: 13.8 %, | 2023: 3.7 %, | 2024: 4.2 %, | 2025: 7.6 %, |
| Rank 11: | Denmark, | 2019: 2.2 %, | 2020: 4.3 %, | 2021: 11.5 %, | 2022: 4.7 %, | 2023: −3.8 %, | 2024: 3.5 %, | 2025: 7.5 %, |
| Rank 11: | Ireland, | 2019: 2.3 %, | 2020: 0.3 %, | 2021: 8.3 %, | 2022: 12.3 %, | 2023: 3.1 %, | 2024: 8.5 %, | 2025: 7.5 %, |
| Rank 13: | Slovenia, | 2019: 6.7 %, | 2020: 4.6 %, | 2021: 11.5 %, | 2022: 14.8 %, | 2023: 7.2 %, | 2024: 7.5 %, | 2025: 7.3 %, |
| Rank 14: | Malta, | 2019: 6.1 %, | 2020: 3.4 %, | 2021: 5.1 %, | 2022: 6.7 %, | 2023: 6.2 %, | 2024: 6.7 %, | 2025: 6.0 %, |
| Rank 15: | Romania, | 2019: 3.4 %, | 2020: 4.7 %, | 2021: 4.4 %, | 2022: 7.2 %, | 2023: 3.3 %, | 2024: 5.0 %, | 2025: 5.7 %, |
| Rank 16: | Estonia, | 2019: 7.0 %, | 2020: 6.0 %, | 2021: 15.1 %, | 2022: 22.2 %, | 2023: 5.9 %, | 2024: 6.1 %, | 2025: 5.2 %, |
| Rank 17: | Poland, | 2019: 8.7 %, | 2020: 10.5 %, | 2021: 9.2 %, | 2022: 11.8 %, | 2023: 8.8 %, | 2024: 15.0 %, | 2025: 4.9 %, |
| Rank 18: | Cyprus, | 2019: 8.4 %, | 2020: 5.2 %, | 2021: −1.5 %, | 2022: 6.5 %, | 2023: 9.2 %, | 2024: 7.3 %, | 2025: 4.5 %, |
| Rank 19: | Italy, | 2019: −0.1 %, | 2020: 1.9 %, | 2021: 2.5 %, | 2022: 3.8 %, | 2023: 1.3 %, | 2024: 3.2 %, | 2025: 4.0 %, |
| Rank 20: | Belgium, | 2019: 3.7 %, | 2020: 4.3 %, | 2021: 6.7 %, | 2022: 5.5 %, | 2023: 2.3 %, | 2024: 3.2 %, | 2025: 3.2 %, |
| Rank 20: | Germany, | 2019: 5.8 %, | 2020: 7.7 %, | 2021: 11.6 %, | 2022: 6.0 %, | 2023: −8.4 %, | 2024: −1.5 %, | 2025: 3.2 %, |
| Rank 22: | Austria, | 2019: 6.0 %, | 2020: 7.6 %, | 2021: 11.4 %, | 2022: 11.6 %, | 2023: −2.9 %, | 2024: −0.4 %, | 2025: 2.5 %, |
| Rank 23: | Luxembourg, | 2019: 9.5 %, | 2020: 14.5 %, | 2021: 14.0 %, | 2022: 9.5 %, | 2023: −9.1 %, | 2024: −5.2 %, | 2025: 1.6 %, |
| Rank 24: | Sweden, | 2019: 2.5 %, | 2020: 4.2 %, | 2021: 10.1 %, | 2022: 3.6 %, | 2023: −5.2 %, | 2024: 0.0 %, | 2025: 1.0 %, |
| Rank 25: | France, | 2019: 3.3 %, | 2020: 5.2 %, | 2021: 6.4 %, | 2022: 6.2 %, | 2023: −0.4 %, | 2024: −3.7 %, | 2025: 0.7 %, |
| Rank 26: | Finland, | 2019: 0.4 %, | 2020: 1.8 %, | 2021: 4.6 %, | 2022: 1.0 %, | 2023: −6.2 %, | 2024: −3.1 %, | 2025: −2.3 %, |
The latest quarters
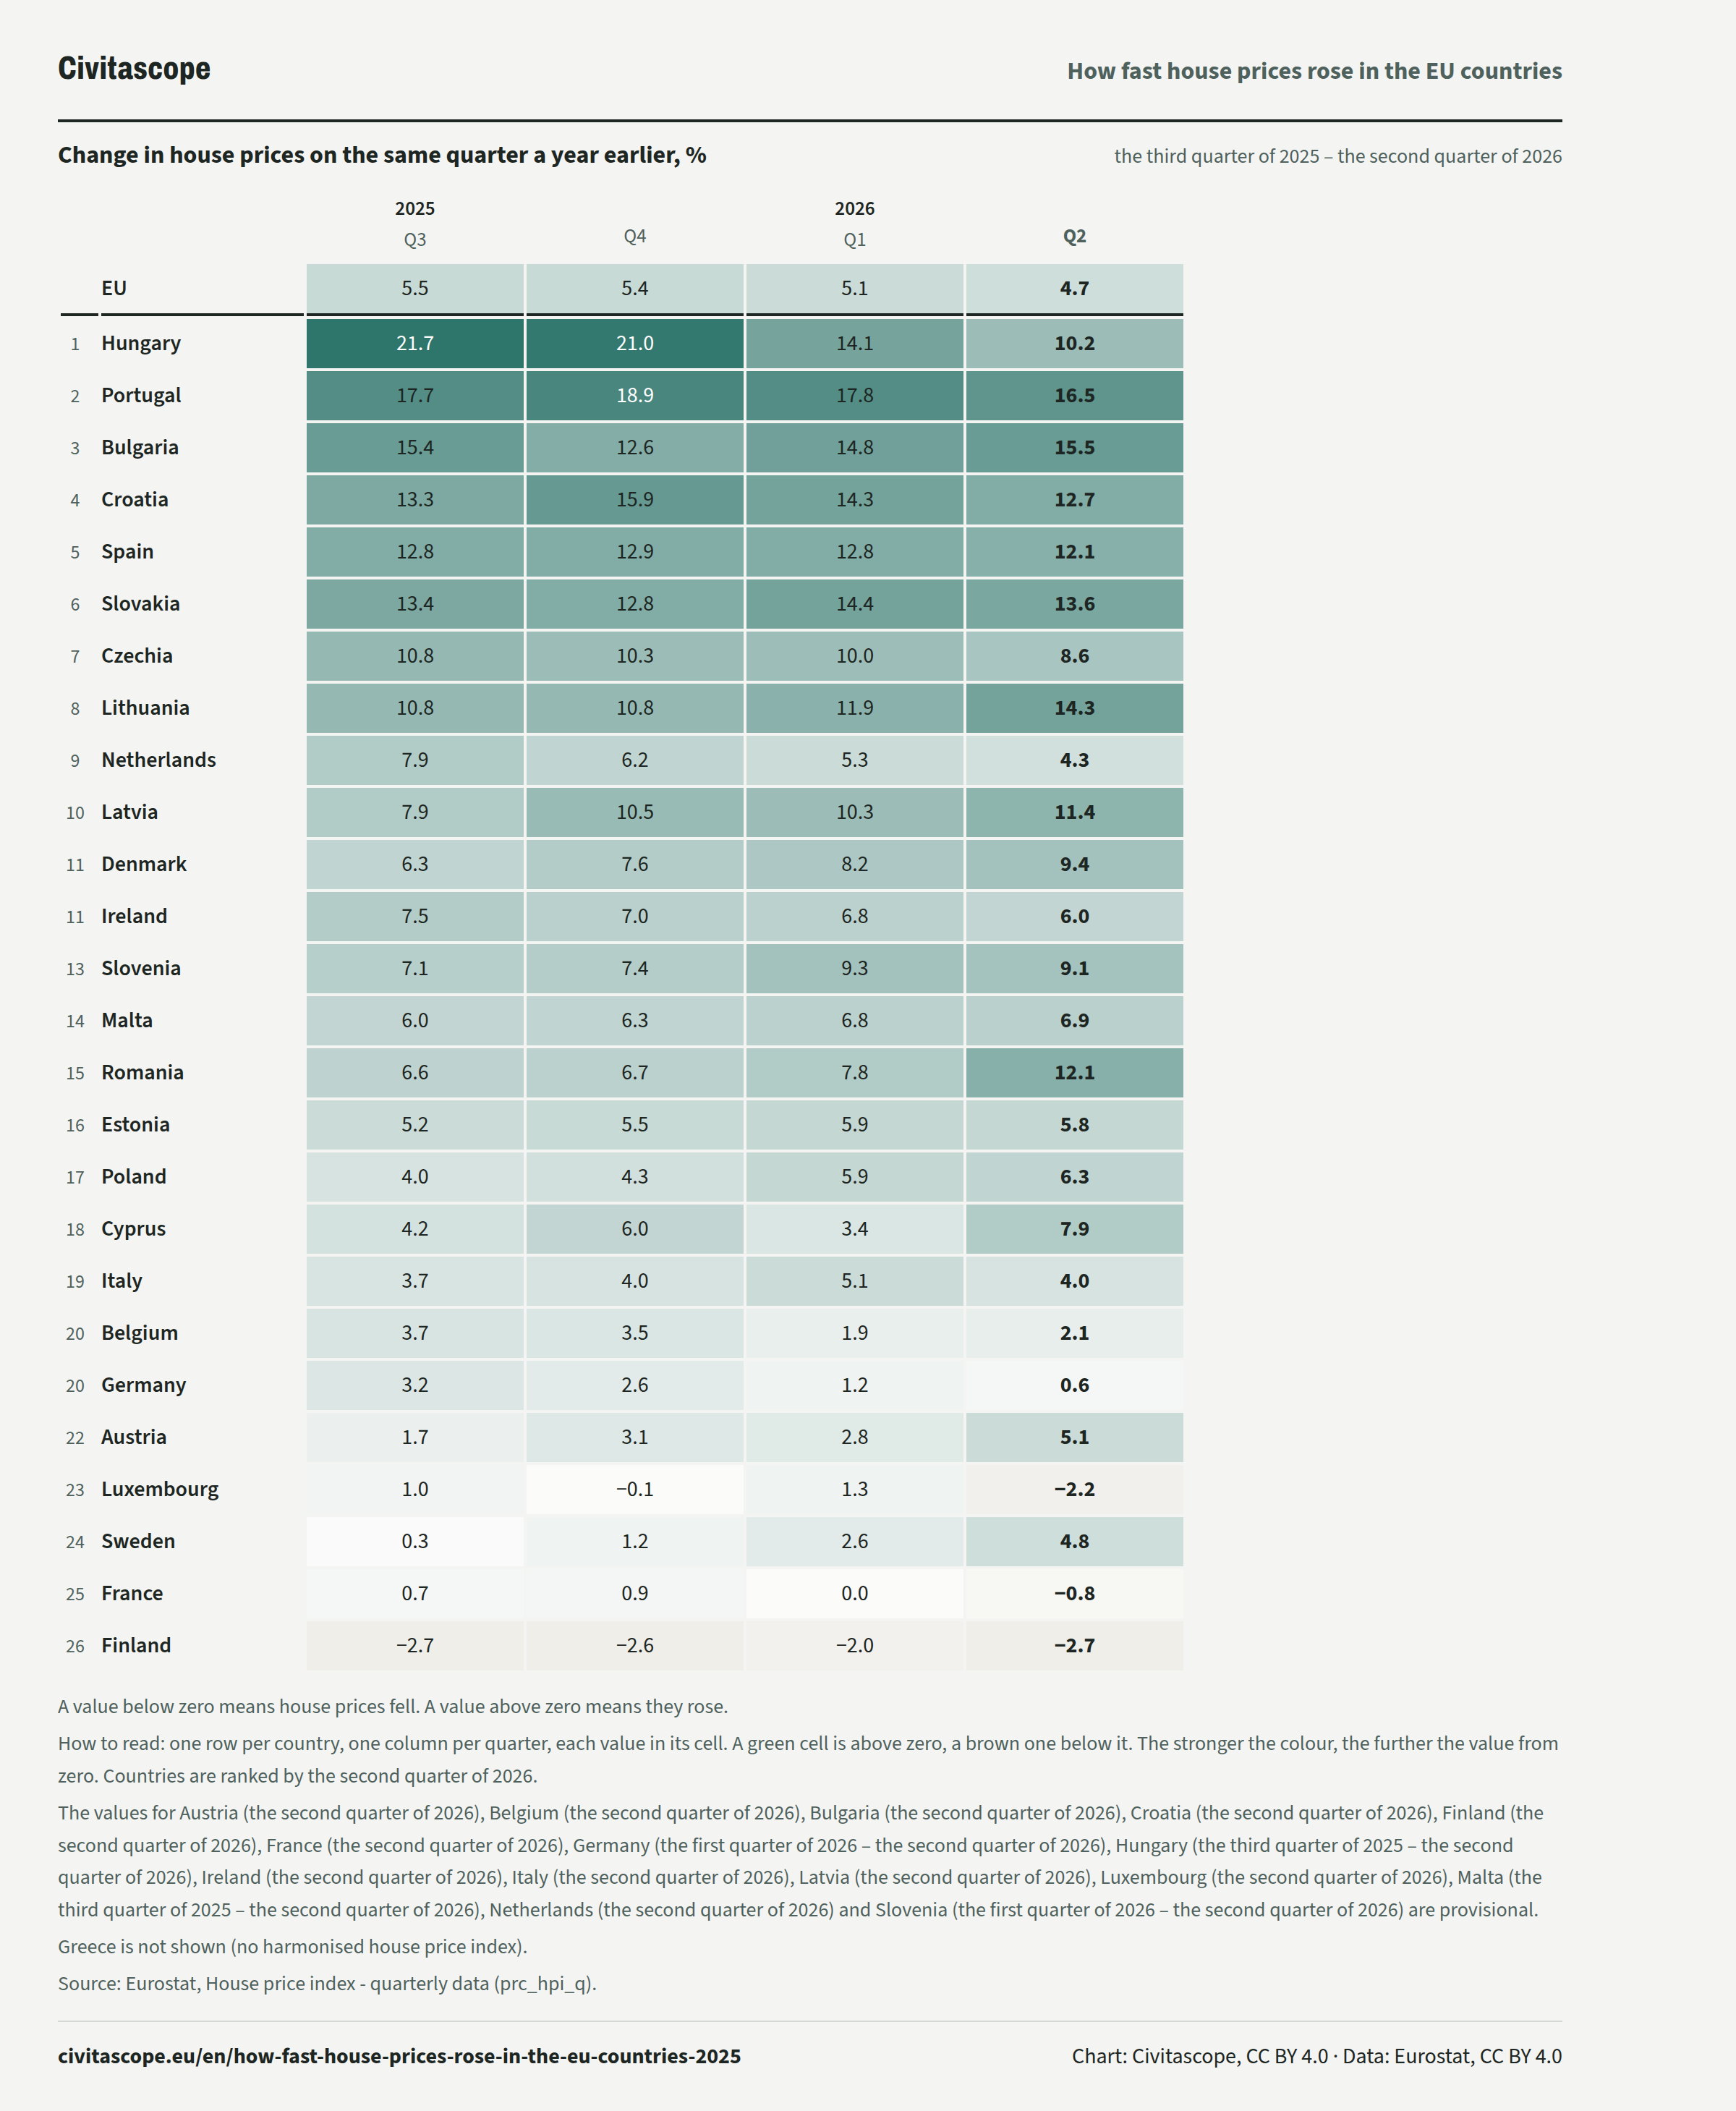
House prices in the EU rose by 5.5% in the third quarter of 2025 and by 4.7% in the second quarter of 2026, each against the same quarter a year earlier.
Change in house prices on the same quarter a year earlier, %
the third quarter of 2025 – the second quarter of 2026| the third quarter of 2025 | the fourth quarter of 2025 | the first quarter of 2026 | the second quarter of 2026 | ||
|---|---|---|---|---|---|
| EU, | the third quarter of 2025: 5.5 %, | the fourth quarter of 2025: 5.4 %, | the first quarter of 2026: 5.1 %, | the second quarter of 2026: 4.7 %, | |
| Rank 1: | Hungary, | the third quarter of 2025: 21.7 %, | the fourth quarter of 2025: 21.0 %, | the first quarter of 2026: 14.1 %, | the second quarter of 2026: 10.2 %, |
| Rank 2: | Portugal, | the third quarter of 2025: 17.7 %, | the fourth quarter of 2025: 18.9 %, | the first quarter of 2026: 17.8 %, | the second quarter of 2026: 16.5 %, |
| Rank 3: | Bulgaria, | the third quarter of 2025: 15.4 %, | the fourth quarter of 2025: 12.6 %, | the first quarter of 2026: 14.8 %, | the second quarter of 2026: 15.5 %, |
| Rank 4: | Croatia, | the third quarter of 2025: 13.3 %, | the fourth quarter of 2025: 15.9 %, | the first quarter of 2026: 14.3 %, | the second quarter of 2026: 12.7 %, |
| Rank 5: | Spain, | the third quarter of 2025: 12.8 %, | the fourth quarter of 2025: 12.9 %, | the first quarter of 2026: 12.8 %, | the second quarter of 2026: 12.1 %, |
| Rank 6: | Slovakia, | the third quarter of 2025: 13.4 %, | the fourth quarter of 2025: 12.8 %, | the first quarter of 2026: 14.4 %, | the second quarter of 2026: 13.6 %, |
| Rank 7: | Czechia, | the third quarter of 2025: 10.8 %, | the fourth quarter of 2025: 10.3 %, | the first quarter of 2026: 10.0 %, | the second quarter of 2026: 8.6 %, |
| Rank 8: | Lithuania, | the third quarter of 2025: 10.8 %, | the fourth quarter of 2025: 10.8 %, | the first quarter of 2026: 11.9 %, | the second quarter of 2026: 14.3 %, |
| Rank 9: | Netherlands, | the third quarter of 2025: 7.9 %, | the fourth quarter of 2025: 6.2 %, | the first quarter of 2026: 5.3 %, | the second quarter of 2026: 4.3 %, |
| Rank 10: | Latvia, | the third quarter of 2025: 7.9 %, | the fourth quarter of 2025: 10.5 %, | the first quarter of 2026: 10.3 %, | the second quarter of 2026: 11.4 %, |
| Rank 11: | Denmark, | the third quarter of 2025: 6.3 %, | the fourth quarter of 2025: 7.6 %, | the first quarter of 2026: 8.2 %, | the second quarter of 2026: 9.4 %, |
| Rank 11: | Ireland, | the third quarter of 2025: 7.5 %, | the fourth quarter of 2025: 7.0 %, | the first quarter of 2026: 6.8 %, | the second quarter of 2026: 6.0 %, |
| Rank 13: | Slovenia, | the third quarter of 2025: 7.1 %, | the fourth quarter of 2025: 7.4 %, | the first quarter of 2026: 9.3 %, | the second quarter of 2026: 9.1 %, |
| Rank 14: | Malta, | the third quarter of 2025: 6.0 %, | the fourth quarter of 2025: 6.3 %, | the first quarter of 2026: 6.8 %, | the second quarter of 2026: 6.9 %, |
| Rank 15: | Romania, | the third quarter of 2025: 6.6 %, | the fourth quarter of 2025: 6.7 %, | the first quarter of 2026: 7.8 %, | the second quarter of 2026: 12.1 %, |
| Rank 16: | Estonia, | the third quarter of 2025: 5.2 %, | the fourth quarter of 2025: 5.5 %, | the first quarter of 2026: 5.9 %, | the second quarter of 2026: 5.8 %, |
| Rank 17: | Poland, | the third quarter of 2025: 4.0 %, | the fourth quarter of 2025: 4.3 %, | the first quarter of 2026: 5.9 %, | the second quarter of 2026: 6.3 %, |
| Rank 18: | Cyprus, | the third quarter of 2025: 4.2 %, | the fourth quarter of 2025: 6.0 %, | the first quarter of 2026: 3.4 %, | the second quarter of 2026: 7.9 %, |
| Rank 19: | Italy, | the third quarter of 2025: 3.7 %, | the fourth quarter of 2025: 4.0 %, | the first quarter of 2026: 5.1 %, | the second quarter of 2026: 4.0 %, |
| Rank 20: | Belgium, | the third quarter of 2025: 3.7 %, | the fourth quarter of 2025: 3.5 %, | the first quarter of 2026: 1.9 %, | the second quarter of 2026: 2.1 %, |
| Rank 20: | Germany, | the third quarter of 2025: 3.2 %, | the fourth quarter of 2025: 2.6 %, | the first quarter of 2026: 1.2 %, | the second quarter of 2026: 0.6 %, |
| Rank 22: | Austria, | the third quarter of 2025: 1.7 %, | the fourth quarter of 2025: 3.1 %, | the first quarter of 2026: 2.8 %, | the second quarter of 2026: 5.1 %, |
| Rank 23: | Luxembourg, | the third quarter of 2025: 1.0 %, | the fourth quarter of 2025: −0.1 %, | the first quarter of 2026: 1.3 %, | the second quarter of 2026: −2.2 %, |
| Rank 24: | Sweden, | the third quarter of 2025: 0.3 %, | the fourth quarter of 2025: 1.2 %, | the first quarter of 2026: 2.6 %, | the second quarter of 2026: 4.8 %, |
| Rank 25: | France, | the third quarter of 2025: 0.7 %, | the fourth quarter of 2025: 0.9 %, | the first quarter of 2026: 0.0 %, | the second quarter of 2026: −0.8 %, |
| Rank 26: | Finland, | the third quarter of 2025: −2.7 %, | the fourth quarter of 2025: −2.6 %, | the first quarter of 2026: −2.0 %, | the second quarter of 2026: −2.7 %, |
In current prices and in real terms
In real terms, after taking out the rise in the prices of what households buy, house prices rose by 14.6% in Portugal and fell by 3.5% in Finland.
Annual average change in house prices, in current prices and in real terms, %
2025(%)
| In current prices | In real terms | |
|---|---|---|
| Lowest | −2.3%Finland | −3.5%Finland |
| Highest | 18.3%Hungary | 14.6%Portugal |
| Highest − lowest | 20.6 pp | 18.1 pp |
New and existing dwellings
In 2025, house prices in the EU rose by 5.7% for existing dwellings and by 4.9% for newly built ones.
Annual average change in house prices, existing and newly built dwellings, %
2025About the data
The change in the transaction prices of dwellings bought by households, including the land they stand on.
Eurostat: “The house price index, abbreviated as HPI, is an index that measures the changes in the transaction prices of dwellings purchased by households.” (source)
National house price indices compiled by the national statistical institutes, mainly from administrative records of property transactions such as land registers and tax databases, in some countries also from mortgage, construction company or estate agent data. Eurostat combines them into the EU and euro area figures.
How to read these numbers
Outside the indicator
Greece has no harmonised house price index. Eurostat estimates Greek house prices from Bank of Greece data based on valuation prices and uses the estimates in the EU and euro area figures.
How it is measured
The index shows how much house prices changed, not how high they are. A country where prices rose fast can still have cheaper homes than a country where they rose slowly.
The yearly rate compares the average price level of the whole year with that of the year before. Eurostat's quarterly news releases compare one quarter with the same quarter a year earlier, and their figures can differ markedly from the yearly rate.
The index is in current prices. It is not adjusted for general inflation, so part of a rise only follows the rise of all consumer prices.
The index covers dwellings bought by households at market prices, new and existing, whether to live in or to let. The price is that of the dwelling itself, land included. Other costs of buying a dwelling are left out, and so are self-built dwellings.
The EU figure is an average of the national indices weighted by each country's economic size. It follows the large countries most closely.
France's index covers metropolitan France, without the overseas regions. Italy's leaves out the provinces of Trento and Bolzano and a few municipalities with a different cadastral system. Cyprus's covers the government-controlled areas, and Finland's leaves out the autonomous region of Åland.
The deflated index divides the house price index by the national accounts price index of everything households buy, not by the consumer price index. Where that price index fell, the deflated rate is above the nominal one.
The deflated figures also change when the national accounts are revised, even where no value is marked provisional.
The EU's deflated figure divides the EU house price index by the EU's price index of household consumption from the national accounts.
Each quarterly rate compares a quarter's price level with that of the same quarter a year earlier. The yearly rate compares the average of a whole year with that of the year before, so the two can differ markedly.
Breaks in the series
A break in the series (flag b) means that a value is not fully comparable with the years before it. This concerns Bulgaria (2022).
Provisional figures
A provisional value (flag p) may still be revised. This concerns Austria (the second quarter of 2026), Belgium (the second quarter of 2026), Bulgaria (the second quarter of 2026), Croatia (the second quarter of 2026), Finland (the second quarter of 2026), France (the second quarter of 2026), Germany (the first quarter of 2026, the second quarter of 2026), Hungary (2024, 2025, the third quarter of 2025, the fourth quarter of 2025, the first quarter of 2026, the second quarter of 2026), Ireland (the second quarter of 2026), Italy (the second quarter of 2026), Latvia (the second quarter of 2026), Luxembourg (the second quarter of 2026), Malta (2025, the third quarter of 2025, the fourth quarter of 2025, the first quarter of 2026, the second quarter of 2026), the Netherlands (the second quarter of 2026) and Slovenia (the first quarter of 2026, the second quarter of 2026).
Sources and data
Eurostat, House price index - annual data (prc_hpi_a). Data updated 1 October 2026, retrieved 6 November 2026. Licence: CC BY 4.0.
Eurostat metadata · Eurostat methodology
https://ec.europa.eu/eurostat/api/dissemination/statistics/1.0/data/prc_hpi_a?format=JSON&lang=en&freq=A&geo=AT&geo=BE&geo=BG&geo=CY&geo=CZ&geo=DE&geo=DK&geo=EE&geo=EL&geo=ES&geo=EU27_2020&geo=FI&geo=FR&geo=HR&geo=HU&geo=IE&geo=IT&geo=LT&geo=LU&geo=LV&geo=MT&geo=NL&geo=PL&geo=PT&geo=RO&geo=SE&geo=SI&geo=SK&purchase=TOTAL&unit=RCH_A_AVGEurostat, House price index, deflated - annual data (tipsho10). Data updated 3 November 2026, retrieved 6 November 2026. Licence: CC BY 4.0.
https://ec.europa.eu/eurostat/api/dissemination/statistics/1.0/data/tipsho10?format=JSON&lang=en&freq=A&geo=AT&geo=BE&geo=BG&geo=CY&geo=CZ&geo=DE&geo=DK&geo=EE&geo=EL&geo=ES&geo=EU27_2020&geo=FI&geo=FR&geo=HR&geo=HU&geo=IE&geo=IT&geo=LT&geo=LU&geo=LV&geo=MT&geo=NL&geo=PL&geo=PT&geo=RO&geo=SE&geo=SI&geo=SK&unit=RCH_A_AVGRelated stories
-
Who owns their home and who rents in the EU
In Slovakia, 93.8% of people live in a home their household owns, against 47.2% in Germany (2025)
-
Housing costs over 40% of income in the EU countries
In Greece, 26.4% of people spend more than 40% of their income on housing, against 2.4% in Cyprus (2025)
-
Overcrowded homes in the EU countries
40.4% of people in Romania live in an overcrowded home, against 2.2% in Cyprus (2025)
-
Living with parents at 25 to 34 across the EU
In Croatia, 62.3% of people aged 25 to 34 live with their parents, against 3.9% in Denmark (2025)