Who uses generative AI in the EU countries
Topic: Digital technology
In Denmark, the share of people using generative AI is 30.6 percentage points higher than in Romania.
In 2025, 32.7% of people aged 16 to 74 in the EU used a generative AI tool. Anyone who used one at least once in the 3 months before the survey counts.
- Figures for:
- 2025.
- Covers:
- differs by country.
- New data:
- once a year.
- Dataset updated:
- 5 June 2026.
Published 29 October 2026, updated 6 November 2026
The ranking
In 2025, the share of people who used generative AI tools in the last 3 months was lowest in Romania, at 17.8%, and highest in Denmark, at 48.4%.
Share of people who used generative AI tools in the last 3 months, %
2025 · people aged 16 to 74Young and old
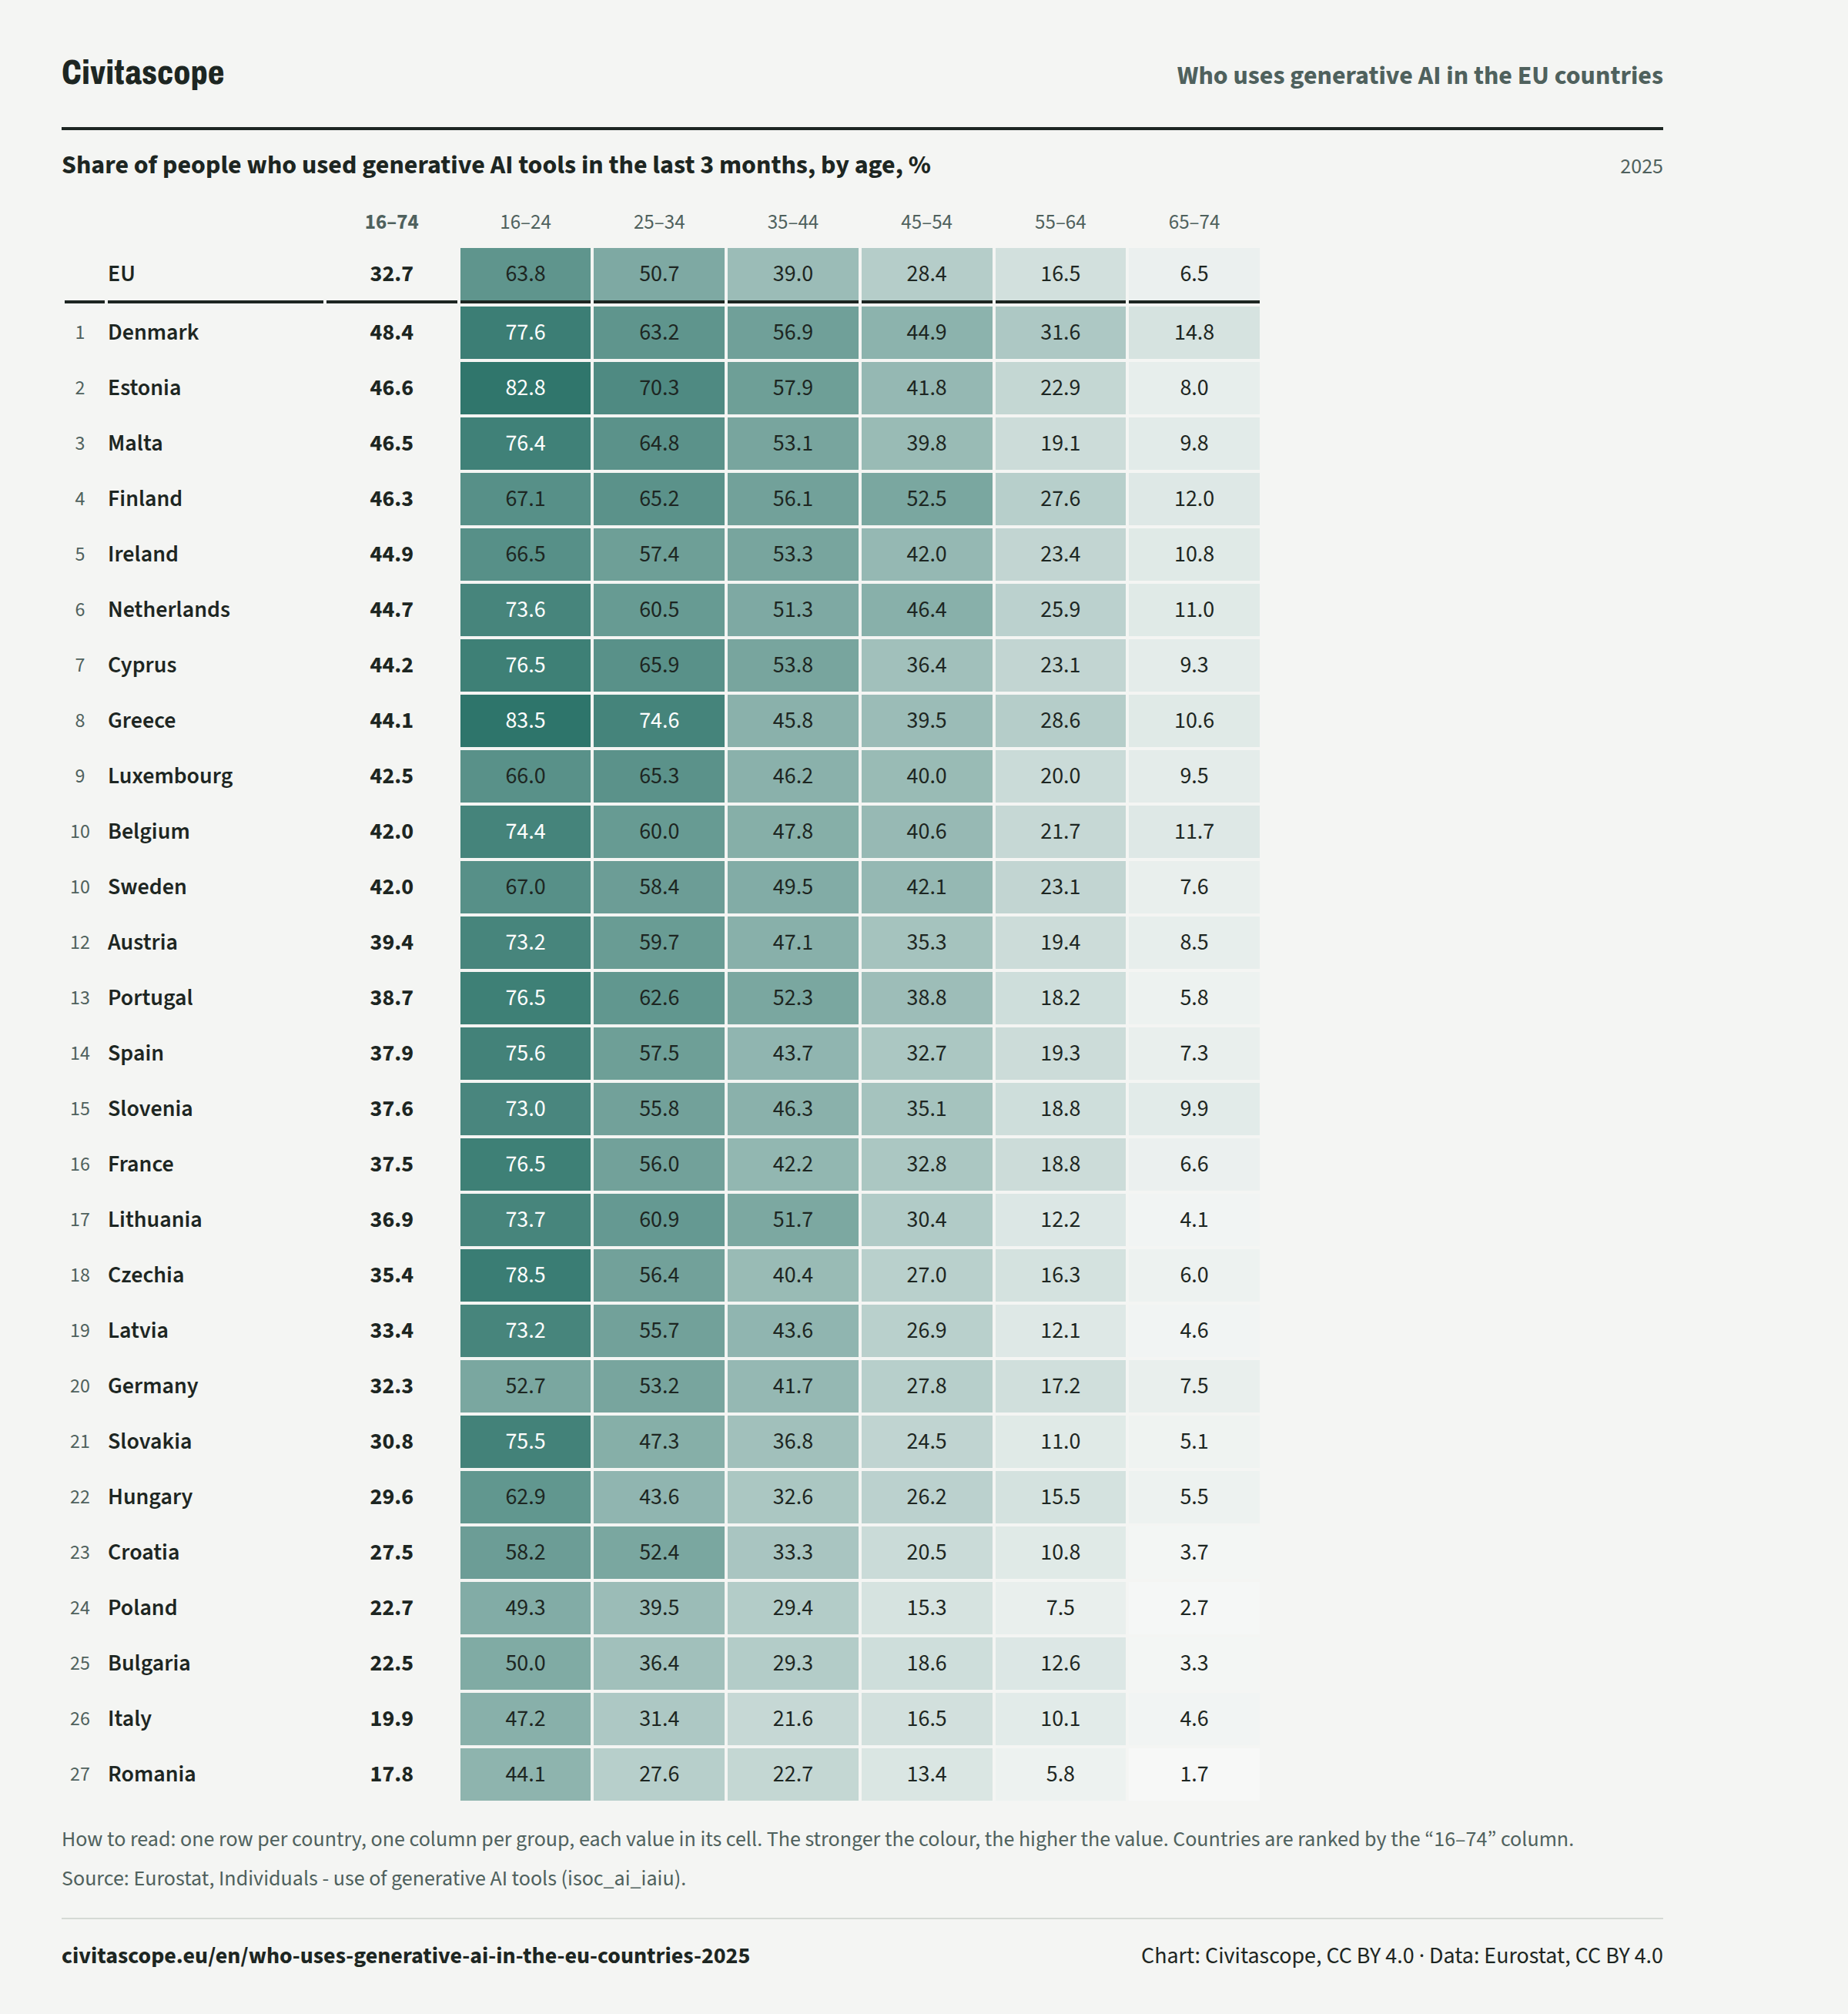
In 2025, 63.8% of people aged 16 to 24 in the EU used a generative AI tool, against 6.5% of people aged 65 to 74.
Share of people who used generative AI tools in the last 3 months, by age, %
2025| 16–74 | 16–24 | 25–34 | 35–44 | 45–54 | 55–64 | 65–74 | ||
|---|---|---|---|---|---|---|---|---|
| EU, | 16–74: 32.7 %, | 16–24: 63.8 %, | 25–34: 50.7 %, | 35–44: 39.0 %, | 45–54: 28.4 %, | 55–64: 16.5 %, | 65–74: 6.5 %, | |
| Rank 1: | Denmark, | 16–74: 48.4 %, | 16–24: 77.6 %, | 25–34: 63.2 %, | 35–44: 56.9 %, | 45–54: 44.9 %, | 55–64: 31.6 %, | 65–74: 14.8 %, |
| Rank 2: | Estonia, | 16–74: 46.6 %, | 16–24: 82.8 %, | 25–34: 70.3 %, | 35–44: 57.9 %, | 45–54: 41.8 %, | 55–64: 22.9 %, | 65–74: 8.0 %, |
| Rank 3: | Malta, | 16–74: 46.5 %, | 16–24: 76.4 %, | 25–34: 64.8 %, | 35–44: 53.1 %, | 45–54: 39.8 %, | 55–64: 19.1 %, | 65–74: 9.8 %, |
| Rank 4: | Finland, | 16–74: 46.3 %, | 16–24: 67.1 %, | 25–34: 65.2 %, | 35–44: 56.1 %, | 45–54: 52.5 %, | 55–64: 27.6 %, | 65–74: 12.0 %, |
| Rank 5: | Ireland, | 16–74: 44.9 %, | 16–24: 66.5 %, | 25–34: 57.4 %, | 35–44: 53.3 %, | 45–54: 42.0 %, | 55–64: 23.4 %, | 65–74: 10.8 %, |
| Rank 6: | Netherlands, | 16–74: 44.7 %, | 16–24: 73.6 %, | 25–34: 60.5 %, | 35–44: 51.3 %, | 45–54: 46.4 %, | 55–64: 25.9 %, | 65–74: 11.0 %, |
| Rank 7: | Cyprus, | 16–74: 44.2 %, | 16–24: 76.5 %, | 25–34: 65.9 %, | 35–44: 53.8 %, | 45–54: 36.4 %, | 55–64: 23.1 %, | 65–74: 9.3 %, |
| Rank 8: | Greece, | 16–74: 44.1 %, | 16–24: 83.5 %, | 25–34: 74.6 %, | 35–44: 45.8 %, | 45–54: 39.5 %, | 55–64: 28.6 %, | 65–74: 10.6 %, |
| Rank 9: | Luxembourg, | 16–74: 42.5 %, | 16–24: 66.0 %, | 25–34: 65.3 %, | 35–44: 46.2 %, | 45–54: 40.0 %, | 55–64: 20.0 %, | 65–74: 9.5 %, |
| Rank 10: | Belgium, | 16–74: 42.0 %, | 16–24: 74.4 %, | 25–34: 60.0 %, | 35–44: 47.8 %, | 45–54: 40.6 %, | 55–64: 21.7 %, | 65–74: 11.7 %, |
| Rank 10: | Sweden, | 16–74: 42.0 %, | 16–24: 67.0 %, | 25–34: 58.4 %, | 35–44: 49.5 %, | 45–54: 42.1 %, | 55–64: 23.1 %, | 65–74: 7.6 %, |
| Rank 12: | Austria, | 16–74: 39.4 %, | 16–24: 73.2 %, | 25–34: 59.7 %, | 35–44: 47.1 %, | 45–54: 35.3 %, | 55–64: 19.4 %, | 65–74: 8.5 %, |
| Rank 13: | Portugal, | 16–74: 38.7 %, | 16–24: 76.5 %, | 25–34: 62.6 %, | 35–44: 52.3 %, | 45–54: 38.8 %, | 55–64: 18.2 %, | 65–74: 5.8 %, |
| Rank 14: | Spain, | 16–74: 37.9 %, | 16–24: 75.6 %, | 25–34: 57.5 %, | 35–44: 43.7 %, | 45–54: 32.7 %, | 55–64: 19.3 %, | 65–74: 7.3 %, |
| Rank 15: | Slovenia, | 16–74: 37.6 %, | 16–24: 73.0 %, | 25–34: 55.8 %, | 35–44: 46.3 %, | 45–54: 35.1 %, | 55–64: 18.8 %, | 65–74: 9.9 %, |
| Rank 16: | France, | 16–74: 37.5 %, | 16–24: 76.5 %, | 25–34: 56.0 %, | 35–44: 42.2 %, | 45–54: 32.8 %, | 55–64: 18.8 %, | 65–74: 6.6 %, |
| Rank 17: | Lithuania, | 16–74: 36.9 %, | 16–24: 73.7 %, | 25–34: 60.9 %, | 35–44: 51.7 %, | 45–54: 30.4 %, | 55–64: 12.2 %, | 65–74: 4.1 %, |
| Rank 18: | Czechia, | 16–74: 35.4 %, | 16–24: 78.5 %, | 25–34: 56.4 %, | 35–44: 40.4 %, | 45–54: 27.0 %, | 55–64: 16.3 %, | 65–74: 6.0 %, |
| Rank 19: | Latvia, | 16–74: 33.4 %, | 16–24: 73.2 %, | 25–34: 55.7 %, | 35–44: 43.6 %, | 45–54: 26.9 %, | 55–64: 12.1 %, | 65–74: 4.6 %, |
| Rank 20: | Germany, | 16–74: 32.3 %, | 16–24: 52.7 %, | 25–34: 53.2 %, | 35–44: 41.7 %, | 45–54: 27.8 %, | 55–64: 17.2 %, | 65–74: 7.5 %, |
| Rank 21: | Slovakia, | 16–74: 30.8 %, | 16–24: 75.5 %, | 25–34: 47.3 %, | 35–44: 36.8 %, | 45–54: 24.5 %, | 55–64: 11.0 %, | 65–74: 5.1 %, |
| Rank 22: | Hungary, | 16–74: 29.6 %, | 16–24: 62.9 %, | 25–34: 43.6 %, | 35–44: 32.6 %, | 45–54: 26.2 %, | 55–64: 15.5 %, | 65–74: 5.5 %, |
| Rank 23: | Croatia, | 16–74: 27.5 %, | 16–24: 58.2 %, | 25–34: 52.4 %, | 35–44: 33.3 %, | 45–54: 20.5 %, | 55–64: 10.8 %, | 65–74: 3.7 %, |
| Rank 24: | Poland, | 16–74: 22.7 %, | 16–24: 49.3 %, | 25–34: 39.5 %, | 35–44: 29.4 %, | 45–54: 15.3 %, | 55–64: 7.5 %, | 65–74: 2.7 %, |
| Rank 25: | Bulgaria, | 16–74: 22.5 %, | 16–24: 50.0 %, | 25–34: 36.4 %, | 35–44: 29.3 %, | 45–54: 18.6 %, | 55–64: 12.6 %, | 65–74: 3.3 %, |
| Rank 26: | Italy, | 16–74: 19.9 %, | 16–24: 47.2 %, | 25–34: 31.4 %, | 35–44: 21.6 %, | 45–54: 16.5 %, | 55–64: 10.1 %, | 65–74: 4.6 %, |
| Rank 27: | Romania, | 16–74: 17.8 %, | 16–24: 44.1 %, | 25–34: 27.6 %, | 35–44: 22.7 %, | 45–54: 13.4 %, | 55–64: 5.8 %, | 65–74: 1.7 %, |
| 16–74 | 16–24 | 25–34 | 35–44 | ||
|---|---|---|---|---|---|
| EU, | 16–74: 32.7 %, | 16–24: 63.8 %, | 25–34: 50.7 %, | 35–44: 39.0 %, | |
| Rank 1: | Denmark, | 16–74: 48.4 %, | 16–24: 77.6 %, | 25–34: 63.2 %, | 35–44: 56.9 %, |
| Rank 2: | Estonia, | 16–74: 46.6 %, | 16–24: 82.8 %, | 25–34: 70.3 %, | 35–44: 57.9 %, |
| Rank 3: | Malta, | 16–74: 46.5 %, | 16–24: 76.4 %, | 25–34: 64.8 %, | 35–44: 53.1 %, |
| Rank 4: | Finland, | 16–74: 46.3 %, | 16–24: 67.1 %, | 25–34: 65.2 %, | 35–44: 56.1 %, |
| Rank 5: | Ireland, | 16–74: 44.9 %, | 16–24: 66.5 %, | 25–34: 57.4 %, | 35–44: 53.3 %, |
| Rank 6: | Netherlands, | 16–74: 44.7 %, | 16–24: 73.6 %, | 25–34: 60.5 %, | 35–44: 51.3 %, |
| Rank 7: | Cyprus, | 16–74: 44.2 %, | 16–24: 76.5 %, | 25–34: 65.9 %, | 35–44: 53.8 %, |
| Rank 8: | Greece, | 16–74: 44.1 %, | 16–24: 83.5 %, | 25–34: 74.6 %, | 35–44: 45.8 %, |
| Rank 9: | Luxembourg, | 16–74: 42.5 %, | 16–24: 66.0 %, | 25–34: 65.3 %, | 35–44: 46.2 %, |
| Rank 10: | Belgium, | 16–74: 42.0 %, | 16–24: 74.4 %, | 25–34: 60.0 %, | 35–44: 47.8 %, |
| Rank 10: | Sweden, | 16–74: 42.0 %, | 16–24: 67.0 %, | 25–34: 58.4 %, | 35–44: 49.5 %, |
| Rank 12: | Austria, | 16–74: 39.4 %, | 16–24: 73.2 %, | 25–34: 59.7 %, | 35–44: 47.1 %, |
| Rank 13: | Portugal, | 16–74: 38.7 %, | 16–24: 76.5 %, | 25–34: 62.6 %, | 35–44: 52.3 %, |
| Rank 14: | Spain, | 16–74: 37.9 %, | 16–24: 75.6 %, | 25–34: 57.5 %, | 35–44: 43.7 %, |
| Rank 15: | Slovenia, | 16–74: 37.6 %, | 16–24: 73.0 %, | 25–34: 55.8 %, | 35–44: 46.3 %, |
| Rank 16: | France, | 16–74: 37.5 %, | 16–24: 76.5 %, | 25–34: 56.0 %, | 35–44: 42.2 %, |
| Rank 17: | Lithuania, | 16–74: 36.9 %, | 16–24: 73.7 %, | 25–34: 60.9 %, | 35–44: 51.7 %, |
| Rank 18: | Czechia, | 16–74: 35.4 %, | 16–24: 78.5 %, | 25–34: 56.4 %, | 35–44: 40.4 %, |
| Rank 19: | Latvia, | 16–74: 33.4 %, | 16–24: 73.2 %, | 25–34: 55.7 %, | 35–44: 43.6 %, |
| Rank 20: | Germany, | 16–74: 32.3 %, | 16–24: 52.7 %, | 25–34: 53.2 %, | 35–44: 41.7 %, |
| Rank 21: | Slovakia, | 16–74: 30.8 %, | 16–24: 75.5 %, | 25–34: 47.3 %, | 35–44: 36.8 %, |
| Rank 22: | Hungary, | 16–74: 29.6 %, | 16–24: 62.9 %, | 25–34: 43.6 %, | 35–44: 32.6 %, |
| Rank 23: | Croatia, | 16–74: 27.5 %, | 16–24: 58.2 %, | 25–34: 52.4 %, | 35–44: 33.3 %, |
| Rank 24: | Poland, | 16–74: 22.7 %, | 16–24: 49.3 %, | 25–34: 39.5 %, | 35–44: 29.4 %, |
| Rank 25: | Bulgaria, | 16–74: 22.5 %, | 16–24: 50.0 %, | 25–34: 36.4 %, | 35–44: 29.3 %, |
| Rank 26: | Italy, | 16–74: 19.9 %, | 16–24: 47.2 %, | 25–34: 31.4 %, | 35–44: 21.6 %, |
| Rank 27: | Romania, | 16–74: 17.8 %, | 16–24: 44.1 %, | 25–34: 27.6 %, | 35–44: 22.7 %, |
| 16–74 | 45–54 | 55–64 | 65–74 | ||
|---|---|---|---|---|---|
| EU, | 16–74: 32.7 %, | 45–54: 28.4 %, | 55–64: 16.5 %, | 65–74: 6.5 %, | |
| Rank 1: | Denmark, | 16–74: 48.4 %, | 45–54: 44.9 %, | 55–64: 31.6 %, | 65–74: 14.8 %, |
| Rank 2: | Estonia, | 16–74: 46.6 %, | 45–54: 41.8 %, | 55–64: 22.9 %, | 65–74: 8.0 %, |
| Rank 3: | Malta, | 16–74: 46.5 %, | 45–54: 39.8 %, | 55–64: 19.1 %, | 65–74: 9.8 %, |
| Rank 4: | Finland, | 16–74: 46.3 %, | 45–54: 52.5 %, | 55–64: 27.6 %, | 65–74: 12.0 %, |
| Rank 5: | Ireland, | 16–74: 44.9 %, | 45–54: 42.0 %, | 55–64: 23.4 %, | 65–74: 10.8 %, |
| Rank 6: | Netherlands, | 16–74: 44.7 %, | 45–54: 46.4 %, | 55–64: 25.9 %, | 65–74: 11.0 %, |
| Rank 7: | Cyprus, | 16–74: 44.2 %, | 45–54: 36.4 %, | 55–64: 23.1 %, | 65–74: 9.3 %, |
| Rank 8: | Greece, | 16–74: 44.1 %, | 45–54: 39.5 %, | 55–64: 28.6 %, | 65–74: 10.6 %, |
| Rank 9: | Luxembourg, | 16–74: 42.5 %, | 45–54: 40.0 %, | 55–64: 20.0 %, | 65–74: 9.5 %, |
| Rank 10: | Belgium, | 16–74: 42.0 %, | 45–54: 40.6 %, | 55–64: 21.7 %, | 65–74: 11.7 %, |
| Rank 10: | Sweden, | 16–74: 42.0 %, | 45–54: 42.1 %, | 55–64: 23.1 %, | 65–74: 7.6 %, |
| Rank 12: | Austria, | 16–74: 39.4 %, | 45–54: 35.3 %, | 55–64: 19.4 %, | 65–74: 8.5 %, |
| Rank 13: | Portugal, | 16–74: 38.7 %, | 45–54: 38.8 %, | 55–64: 18.2 %, | 65–74: 5.8 %, |
| Rank 14: | Spain, | 16–74: 37.9 %, | 45–54: 32.7 %, | 55–64: 19.3 %, | 65–74: 7.3 %, |
| Rank 15: | Slovenia, | 16–74: 37.6 %, | 45–54: 35.1 %, | 55–64: 18.8 %, | 65–74: 9.9 %, |
| Rank 16: | France, | 16–74: 37.5 %, | 45–54: 32.8 %, | 55–64: 18.8 %, | 65–74: 6.6 %, |
| Rank 17: | Lithuania, | 16–74: 36.9 %, | 45–54: 30.4 %, | 55–64: 12.2 %, | 65–74: 4.1 %, |
| Rank 18: | Czechia, | 16–74: 35.4 %, | 45–54: 27.0 %, | 55–64: 16.3 %, | 65–74: 6.0 %, |
| Rank 19: | Latvia, | 16–74: 33.4 %, | 45–54: 26.9 %, | 55–64: 12.1 %, | 65–74: 4.6 %, |
| Rank 20: | Germany, | 16–74: 32.3 %, | 45–54: 27.8 %, | 55–64: 17.2 %, | 65–74: 7.5 %, |
| Rank 21: | Slovakia, | 16–74: 30.8 %, | 45–54: 24.5 %, | 55–64: 11.0 %, | 65–74: 5.1 %, |
| Rank 22: | Hungary, | 16–74: 29.6 %, | 45–54: 26.2 %, | 55–64: 15.5 %, | 65–74: 5.5 %, |
| Rank 23: | Croatia, | 16–74: 27.5 %, | 45–54: 20.5 %, | 55–64: 10.8 %, | 65–74: 3.7 %, |
| Rank 24: | Poland, | 16–74: 22.7 %, | 45–54: 15.3 %, | 55–64: 7.5 %, | 65–74: 2.7 %, |
| Rank 25: | Bulgaria, | 16–74: 22.5 %, | 45–54: 18.6 %, | 55–64: 12.6 %, | 65–74: 3.3 %, |
| Rank 26: | Italy, | 16–74: 19.9 %, | 45–54: 16.5 %, | 55–64: 10.1 %, | 65–74: 4.6 %, |
| Rank 27: | Romania, | 16–74: 17.8 %, | 45–54: 13.4 %, | 55–64: 5.8 %, | 65–74: 1.7 %, |
What people use it for
In 2025, 78.04% of the people in the EU who used generative AI tools used them for private purposes, 47.02% for work and 28.54% for formal education.
Users of generative AI tools by purpose, % of users
2025About the data
The share of people aged 16 to 74 who used a generative artificial intelligence (AI) tool, one that creates new content such as text, images or programming code in response to a user's prompt, at least once in the 3 months before the survey.
Counted: people aged 16 to 74.
Left out:
- people living in institutions such as hospitals or prisons
Eurostat: “Generative artificial intelligence (AI) tool can create new content, such as text, images, programming code, videos, or other data, based on available information and patterns it has learned from existing examples.” (source)
The data come from a sample survey, the EU survey on the use of ICT in households and by individuals. The national statistical institutes run it every year. In 2025 about 330,000 people aged 16 to 74 answered it. The figures are what people reported about themselves.
How to read these numbers
How it is measured
Questions on generative AI were first asked in 2025, so there are no earlier figures to compare with.
The survey counts only the conscious use of generative AI tools, and the question gives examples such as ChatGPT, Copilot and Gemini. AI built into other software, such as AI assistants or AI-powered search, may not be counted.
A person counts as a user after one use of a generative AI tool in the 3 months before the survey. The figures do not show how often people use these tools.
Each person was asked about the 3 months before their interview, and the countries held their interviews at different times. In 2025 they ran from 13 January to 8 April in Italy, for example, and from 3 June to 3 August in Luxembourg. Cyprus and Greece asked about the first quarter of 2025.
A user can name more than one purpose. The shares by purpose therefore overlap and cannot be added up.
Sources and data
Eurostat, Individuals - use of generative AI tools (isoc_ai_iaiu). Data updated 5 June 2026, retrieved 3 November 2026. Licence: CC BY 4.0.
Eurostat metadata · Eurostat methodology
https://ec.europa.eu/eurostat/api/dissemination/statistics/1.0/data/isoc_ai_iaiu?format=JSON&lang=en&freq=A&geo=AT&geo=BE&geo=BG&geo=CY&geo=CZ&geo=DE&geo=DK&geo=EE&geo=EL&geo=ES&geo=EU27_2020&geo=FI&geo=FR&geo=HR&geo=HU&geo=IE&geo=IT&geo=LT&geo=LU&geo=LV&geo=MT&geo=NL&geo=PL&geo=PT&geo=RO&geo=SE&geo=SI&geo=SK&ind_type=IND_TOTAL&indic_is=I_IUAI&unit=PC_INDRelated stories
-
Shopping online in the EU countries
95.1% of people aged 16 to 74 in Ireland bought something online in a year, against 51.2% in Bulgaria (2025)
-
Who has never been online in the EU
In Croatia, 10.33% of people aged 16 to 74 have never used the internet, against 0.20% in Ireland (2025)
-
Electric cars among new cars in the EU
In Denmark, 67.8% of new cars were battery-only electric, against 1.9% in Croatia (2025)
-
Cars per 1,000 inhabitants in the EU countries
Italy has 1.6 times as many cars per inhabitant as Latvia (2025)