Who usually works on Sundays in the EU
Topic: Work and income
In Malta, 21.7% of employed people usually work on Sundays, against 2.7% in Lithuania.
In 2025, 11.2% of employed people aged 15 to 64 in the EU usually worked on Sundays, on at least two Sundays a month.
- Figures for:
- 2025.
- Covers:
- the whole year.
- New data:
- every two years.
- Dataset updated:
- 30 October 2026.
Published 12 November 2026
The ranking
In 2025, the share of employed people who usually work on Sundays was lowest in Lithuania, at 2.7%, and highest in Malta, at 21.7%.
Share of employed people who usually work on Sundays, %
2025 · employed people aged 15 to 64Employees and the self-employed
Among employees, the gap between the highest and the lowest country was slightly wider than among all employed people. Malta was again the highest, at 21.8%, and Lithuania again the lowest, at 2.0%. The gap between Malta and Lithuania was 19.8 percentage points.
Among self-employed people, the gap between the highest and the lowest country was slightly wider than among employees. Austria was the highest, at 27.2%, and Hungary the lowest, at 6.9%. The highest and the lowest were 20.3 percentage points apart.
Share of employed people who usually work on Sundays: employees and self-employed, %
2025| Everyone | Employees | Self-employed | |
|---|---|---|---|
| Lowest | 2.7%Lithuania | 2.0%Lithuania | 6.9%Hungary |
| Highest | 21.7%Malta | 21.8%Malta | 27.2%Austria |
| Highest − lowest | 19.0 pp | 19.8 pp | 20.3 pp |
Women and men
Among employed women, the gap between the highest and the lowest country was narrower than among all employed people. Lithuania was again the lowest, at 3.0%, and Malta again the highest, at 19.3%. The gap between the highest and the lowest was 16.3 percentage points.
Among employed men, the gap between the highest and the lowest country was wider than among employed women. Malta was again the highest, at 23.5%, and Lithuania again the lowest, at 2.5%. The gap between Malta and Lithuania was 21.0 percentage points.
Share of employed people who usually work on Sundays: women and men, %
2025 · employed people aged 15 to 64| Everyone | Women | Men | |
|---|---|---|---|
| Lowest | 2.7%Lithuania | 3.0%Lithuania | 2.5%Lithuania |
| Highest | 21.7%Malta | 19.3%Malta | 23.5%Malta |
| Highest − lowest | 19.0 pp | 16.3 pp | 21.0 pp |
Usually, sometimes, never
In 2025, 11.2% of employed people in the EU usually worked on Sundays, 10.7% sometimes and 78.1% never.
Employed people working on Sundays, usually, sometimes and never, %
2025 · employed people aged 15 to 64By age
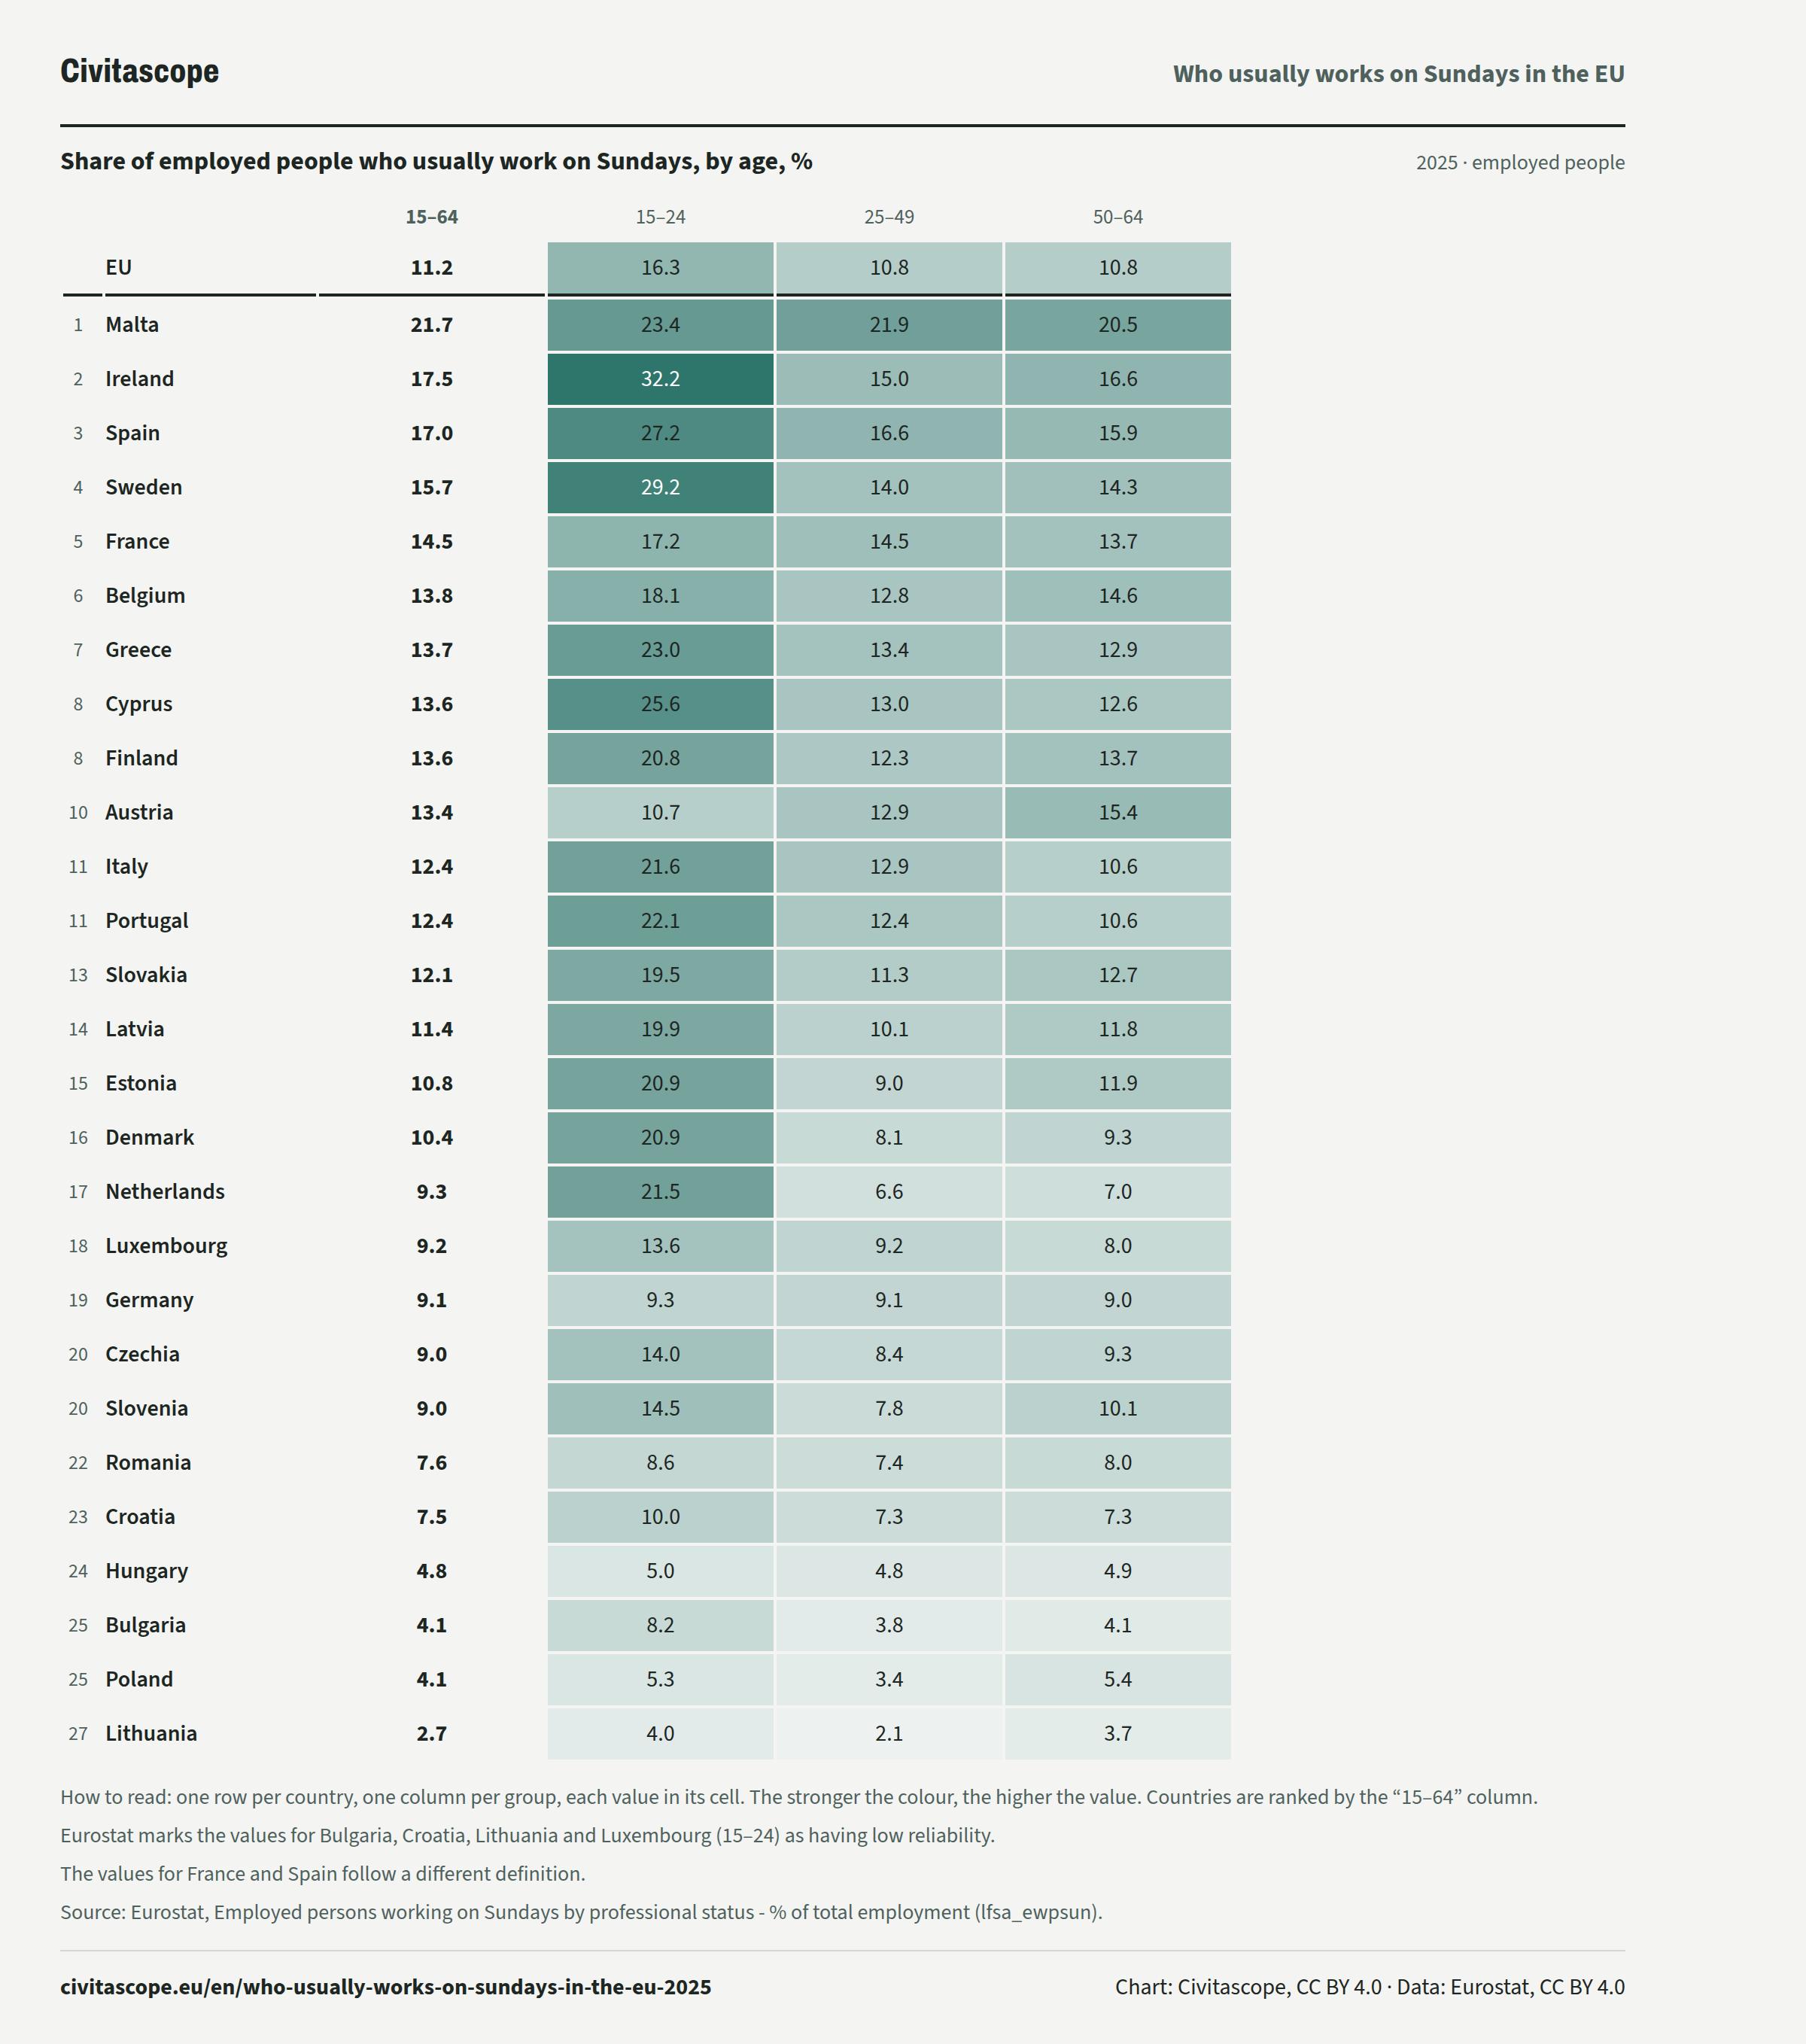
In 2025, 16.3% of employed people aged 15 to 24 in the EU usually worked on Sundays, against 10.8% of those aged 25 to 49.
Share of employed people who usually work on Sundays, by age, %
2025 · employed people| 15–64 | 15–24 | 25–49 | 50–64 | ||
|---|---|---|---|---|---|
| EU, | 15–64: 11.2%, | 15–24: 16.3%, | 25–49: 10.8%, | 50–64: 10.8%, | |
| Rank 1: | Malta, | 15–64: 21.7%, | 15–24: 23.4%, | 25–49: 21.9%, | 50–64: 20.5%, |
| Rank 2: | Ireland, | 15–64: 17.5%, | 15–24: 32.2%, | 25–49: 15.0%, | 50–64: 16.6%, |
| Rank 3: | Spain, | 15–64: 17.0%, | 15–24: 27.2%, | 25–49: 16.6%, | 50–64: 15.9%, |
| Rank 4: | Sweden, | 15–64: 15.7%, | 15–24: 29.2%, | 25–49: 14.0%, | 50–64: 14.3%, |
| Rank 5: | France, | 15–64: 14.5%, | 15–24: 17.2%, | 25–49: 14.5%, | 50–64: 13.7%, |
| Rank 6: | Belgium, | 15–64: 13.8%, | 15–24: 18.1%, | 25–49: 12.8%, | 50–64: 14.6%, |
| Rank 7: | Greece, | 15–64: 13.7%, | 15–24: 23.0%, | 25–49: 13.4%, | 50–64: 12.9%, |
| Rank 8: | Cyprus, | 15–64: 13.6%, | 15–24: 25.6%, | 25–49: 13.0%, | 50–64: 12.6%, |
| Rank 8: | Finland, | 15–64: 13.6%, | 15–24: 20.8%, | 25–49: 12.3%, | 50–64: 13.7%, |
| Rank 10: | Austria, | 15–64: 13.4%, | 15–24: 10.7%, | 25–49: 12.9%, | 50–64: 15.4%, |
| Rank 11: | Italy, | 15–64: 12.4%, | 15–24: 21.6%, | 25–49: 12.9%, | 50–64: 10.6%, |
| Rank 11: | Portugal, | 15–64: 12.4%, | 15–24: 22.1%, | 25–49: 12.4%, | 50–64: 10.6%, |
| Rank 13: | Slovakia, | 15–64: 12.1%, | 15–24: 19.5%, | 25–49: 11.3%, | 50–64: 12.7%, |
| Rank 14: | Latvia, | 15–64: 11.4%, | 15–24: 19.9%, | 25–49: 10.1%, | 50–64: 11.8%, |
| Rank 15: | Estonia, | 15–64: 10.8%, | 15–24: 20.9%, | 25–49: 9.0%, | 50–64: 11.9%, |
| Rank 16: | Denmark, | 15–64: 10.4%, | 15–24: 20.9%, | 25–49: 8.1%, | 50–64: 9.3%, |
| Rank 17: | Netherlands, | 15–64: 9.3%, | 15–24: 21.5%, | 25–49: 6.6%, | 50–64: 7.0%, |
| Rank 18: | Luxembourg, | 15–64: 9.2%, | 15–24: 13.6%, | 25–49: 9.2%, | 50–64: 8.0%, |
| Rank 19: | Germany, | 15–64: 9.1%, | 15–24: 9.3%, | 25–49: 9.1%, | 50–64: 9.0%, |
| Rank 20: | Czechia, | 15–64: 9.0%, | 15–24: 14.0%, | 25–49: 8.4%, | 50–64: 9.3%, |
| Rank 20: | Slovenia, | 15–64: 9.0%, | 15–24: 14.5%, | 25–49: 7.8%, | 50–64: 10.1%, |
| Rank 22: | Romania, | 15–64: 7.6%, | 15–24: 8.6%, | 25–49: 7.4%, | 50–64: 8.0%, |
| Rank 23: | Croatia, | 15–64: 7.5%, | 15–24: 10.0%, | 25–49: 7.3%, | 50–64: 7.3%, |
| Rank 24: | Hungary, | 15–64: 4.8%, | 15–24: 5.0%, | 25–49: 4.8%, | 50–64: 4.9%, |
| Rank 25: | Bulgaria, | 15–64: 4.1%, | 15–24: 8.2%, | 25–49: 3.8%, | 50–64: 4.1%, |
| Rank 25: | Poland, | 15–64: 4.1%, | 15–24: 5.3%, | 25–49: 3.4%, | 50–64: 5.4%, |
| Rank 27: | Lithuania, | 15–64: 2.7%, | 15–24: 4.0%, | 25–49: 2.1%, | 50–64: 3.7%, |
About the data
The share of employed people who usually work on Sundays in their main job, meaning at least two Sundays a month in the four working weeks up to the end of the survey week (twelve working weeks when the last four were unusual).
Counted: employed people aged 15 to 64.
Eurostat: “'Frequently' in this context should be interpreted as: working at least two of the Sundays per month in a reference period of four (to twelve) working weeks preceding the end of the reference week.” (source)
EU Labour Force Survey (EU-LFS), a sample survey of households run by the national statistical institutes. The answer is the respondent's own account of the Sundays worked in the main job.
How to read these numbers
How it is measured
The survey covers people usually living in private households. People in collective or institutional households are not included.
"Usually" means working on at least two Sundays a month in the four working weeks up to the end of the survey week, or in the twelve working weeks up to it when the last four were unusual. People who worked on one Sunday a month count as working on Sundays sometimes. Only the main job counts. Occasionally checking emails or answering calls on a Sunday does not count as work.
Since 2021 the survey asks about Sunday work every two years, in odd years. There are no values for 2022 and 2024. Until 2020 the series is yearly.
France's figures have included the overseas departments Guadeloupe, Martinique, French Guiana and Réunion since 2014, and Mayotte since 2024. Cyprus's figures cover only the areas controlled by the government of the Republic of Cyprus.
Different definitions
Eurostat marks Spain's and France's values as following a different definition (flag d). Both countries still use the rules of 2020 and before to decide whether people on temporary lay-off count as employed. This concerns France (2025) and Spain (2025).
Low reliability
A value of low reliability (flag u) should be read with care. This concerns Bulgaria (2025), Croatia (2025), Lithuania (2025) and Luxembourg (2025).
Sources and data
Eurostat, Employed persons working on Sundays by professional status - % of total employment (lfsa_ewpsun). Data updated 30 October 2026, retrieved 12 November 2026. Licence: CC BY 4.0.
Eurostat metadata · Eurostat methodology
https://ec.europa.eu/eurostat/api/dissemination/statistics/1.0/data/lfsa_ewpsun?format=JSON&lang=en&age=Y15-64&freq=A&frequenc=USU&geo=AT&geo=BE&geo=BG&geo=CY&geo=CZ&geo=DE&geo=DK&geo=EE&geo=EL&geo=ES&geo=EU27_2020&geo=FI&geo=FR&geo=HR&geo=HU&geo=IE&geo=IT&geo=LT&geo=LU&geo=LV&geo=MT&geo=NL&geo=PL&geo=PT&geo=RO&geo=SE&geo=SI&geo=SK&sex=T&unit=PC&wstatus=EMPReport an error: contact [at] civitascope.eu
Related stories
-
Household income per inhabitant in the EU regions
In Luxembourg, the net primary income of households was 36,200 PPS per inhabitant, against 13,200 PPS per inhabitant in Bulgaria (2023)
-
Net annual earnings of an average single worker in the EU
Adjusted for price levels, a single worker on the average wage takes home 2.0 times as much in Luxembourg as in Hungary (2025)
-
The gender pension gap in the EU countries
In Malta, women's average pension is 38.5% below men's, against 3.5% in Estonia (2025)
-
Hourly labour costs in the EU countries
An hour of work costs employers 5.2 times as much in Luxembourg as in Bulgaria (2024)