Adults in education or training in the EU
Topic: Education
In Sweden, 38.2% of people aged 25 to 64 took part in education or training in the last four weeks, against 5.2% in Greece.
In 2025, 13.7% of people aged 25 to 64 in the EU took part in education or training in the four weeks before the survey. Formal education counts, and so do courses, seminars, workshops and private lessons.
- Figures for:
- 2025.
- Covers:
- the whole year.
- New data:
- once a year.
- Dataset updated:
- 30 October 2026.
Published 7 November 2026
The ranking
In 2025, the share of people aged 25 to 64 who took part in education or training in the last four weeks was lowest in Greece, at 5.2%, and highest in Sweden, at 38.2%.
Share of people aged 25 to 64 who took part in education or training in the last four weeks, %
2025 · aged 25 to 64Women and men
Among men, the spread across countries was narrower. Sweden was again the highest, at 31.7%, and Greece again the lowest, at 5.0%. The highest and the lowest were 26.7 percentage points apart.
Among women, the spread across countries was wider than among men. Greece was again the lowest, at 5.4%, and Sweden again the highest, at 44.9%. The gap was 39.5 percentage points.
Share of people aged 25 to 64 who took part in education or training in the last four weeks: men and women, %
2025 · aged 25 to 64| Everyone | Men | Women | |
|---|---|---|---|
| Lowest | 5.2%Greece | 5.0%Greece | 5.4%Greece |
| Highest | 38.2%Sweden | 31.7%Sweden | 44.9%Sweden |
| Highest − lowest | 33.0 pp | 26.7 pp | 39.5 pp |
By age
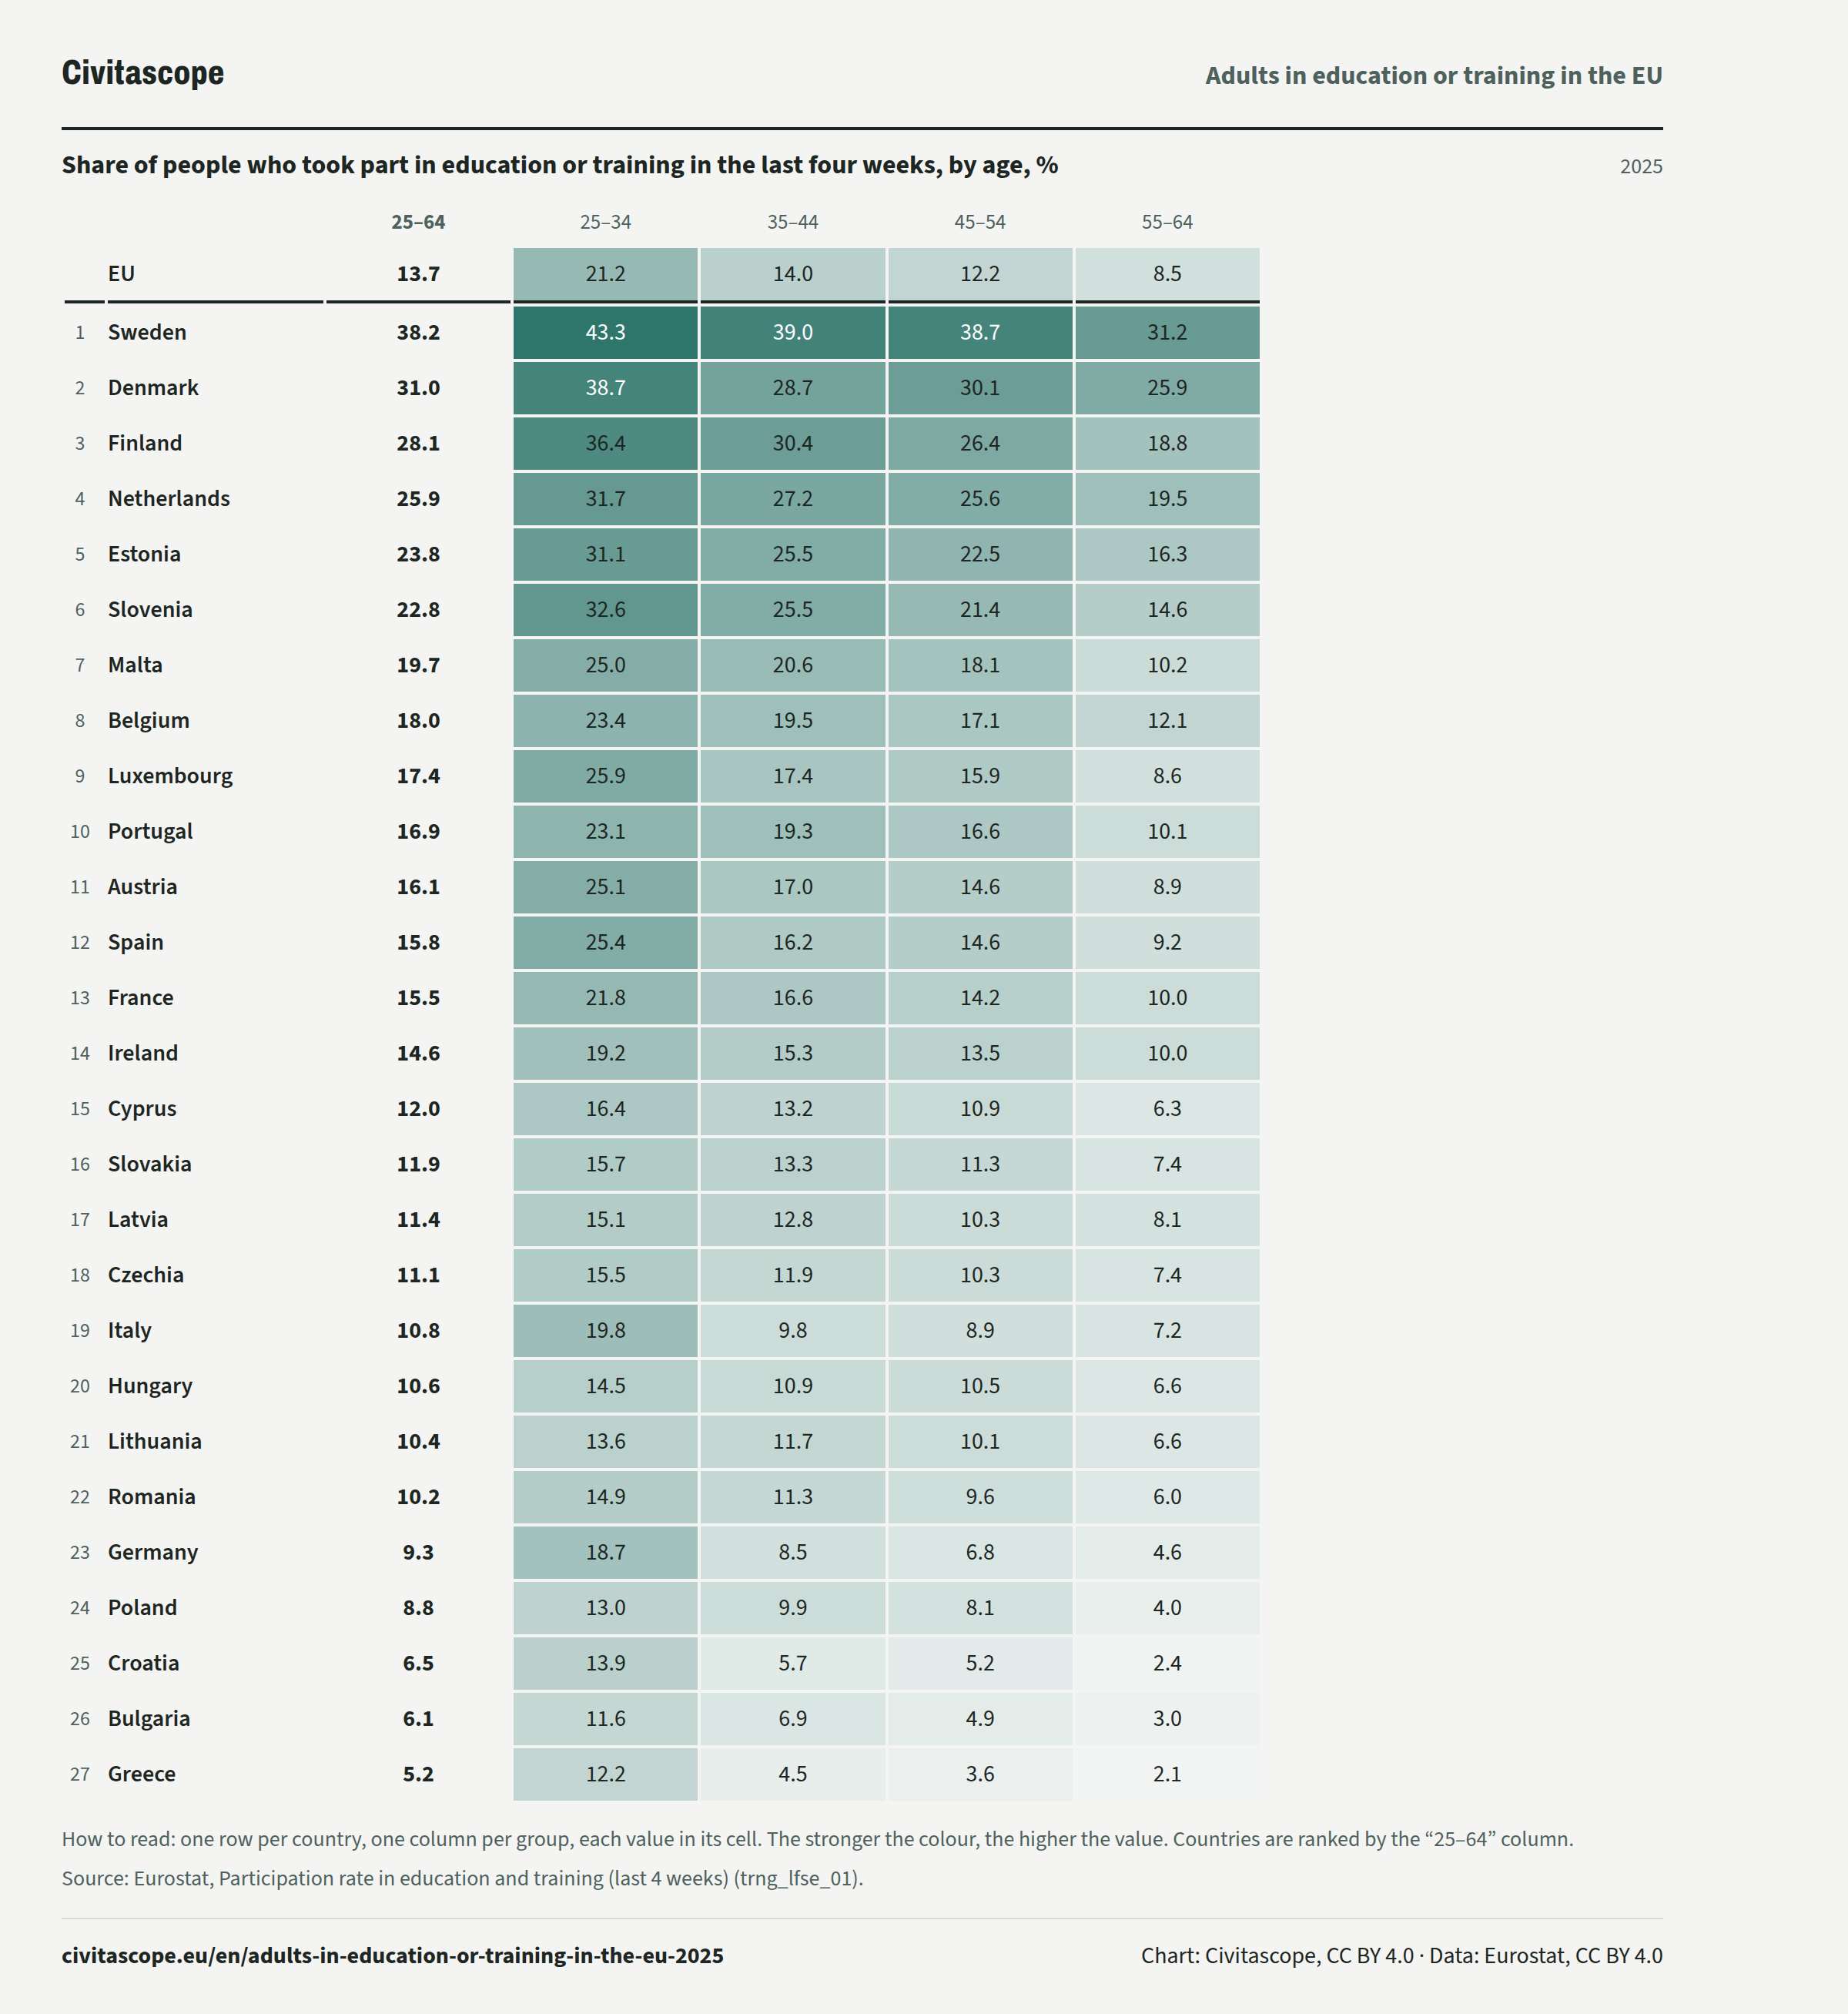
In 2025, 21.2% of people aged 25 to 34 in the EU took part in education or training in the last four weeks, against 8.5% of people aged 55 to 64.
Share of people who took part in education or training in the last four weeks, by age, %
2025| 25–64 | 25–34 | 35–44 | 45–54 | 55–64 | ||
|---|---|---|---|---|---|---|
| EU, | 25–64: 13.7 %, | 25–34: 21.2 %, | 35–44: 14.0 %, | 45–54: 12.2 %, | 55–64: 8.5 %, | |
| Rank 1: | Sweden, | 25–64: 38.2 %, | 25–34: 43.3 %, | 35–44: 39.0 %, | 45–54: 38.7 %, | 55–64: 31.2 %, |
| Rank 2: | Denmark, | 25–64: 31.0 %, | 25–34: 38.7 %, | 35–44: 28.7 %, | 45–54: 30.1 %, | 55–64: 25.9 %, |
| Rank 3: | Finland, | 25–64: 28.1 %, | 25–34: 36.4 %, | 35–44: 30.4 %, | 45–54: 26.4 %, | 55–64: 18.8 %, |
| Rank 4: | Netherlands, | 25–64: 25.9 %, | 25–34: 31.7 %, | 35–44: 27.2 %, | 45–54: 25.6 %, | 55–64: 19.5 %, |
| Rank 5: | Estonia, | 25–64: 23.8 %, | 25–34: 31.1 %, | 35–44: 25.5 %, | 45–54: 22.5 %, | 55–64: 16.3 %, |
| Rank 6: | Slovenia, | 25–64: 22.8 %, | 25–34: 32.6 %, | 35–44: 25.5 %, | 45–54: 21.4 %, | 55–64: 14.6 %, |
| Rank 7: | Malta, | 25–64: 19.7 %, | 25–34: 25.0 %, | 35–44: 20.6 %, | 45–54: 18.1 %, | 55–64: 10.2 %, |
| Rank 8: | Belgium, | 25–64: 18.0 %, | 25–34: 23.4 %, | 35–44: 19.5 %, | 45–54: 17.1 %, | 55–64: 12.1 %, |
| Rank 9: | Luxembourg, | 25–64: 17.4 %, | 25–34: 25.9 %, | 35–44: 17.4 %, | 45–54: 15.9 %, | 55–64: 8.6 %, |
| Rank 10: | Portugal, | 25–64: 16.9 %, | 25–34: 23.1 %, | 35–44: 19.3 %, | 45–54: 16.6 %, | 55–64: 10.1 %, |
| Rank 11: | Austria, | 25–64: 16.1 %, | 25–34: 25.1 %, | 35–44: 17.0 %, | 45–54: 14.6 %, | 55–64: 8.9 %, |
| Rank 12: | Spain, | 25–64: 15.8 %, | 25–34: 25.4 %, | 35–44: 16.2 %, | 45–54: 14.6 %, | 55–64: 9.2 %, |
| Rank 13: | France, | 25–64: 15.5 %, | 25–34: 21.8 %, | 35–44: 16.6 %, | 45–54: 14.2 %, | 55–64: 10.0 %, |
| Rank 14: | Ireland, | 25–64: 14.6 %, | 25–34: 19.2 %, | 35–44: 15.3 %, | 45–54: 13.5 %, | 55–64: 10.0 %, |
| Rank 15: | Cyprus, | 25–64: 12.0 %, | 25–34: 16.4 %, | 35–44: 13.2 %, | 45–54: 10.9 %, | 55–64: 6.3 %, |
| Rank 16: | Slovakia, | 25–64: 11.9 %, | 25–34: 15.7 %, | 35–44: 13.3 %, | 45–54: 11.3 %, | 55–64: 7.4 %, |
| Rank 17: | Latvia, | 25–64: 11.4 %, | 25–34: 15.1 %, | 35–44: 12.8 %, | 45–54: 10.3 %, | 55–64: 8.1 %, |
| Rank 18: | Czechia, | 25–64: 11.1 %, | 25–34: 15.5 %, | 35–44: 11.9 %, | 45–54: 10.3 %, | 55–64: 7.4 %, |
| Rank 19: | Italy, | 25–64: 10.8 %, | 25–34: 19.8 %, | 35–44: 9.8 %, | 45–54: 8.9 %, | 55–64: 7.2 %, |
| Rank 20: | Hungary, | 25–64: 10.6 %, | 25–34: 14.5 %, | 35–44: 10.9 %, | 45–54: 10.5 %, | 55–64: 6.6 %, |
| Rank 21: | Lithuania, | 25–64: 10.4 %, | 25–34: 13.6 %, | 35–44: 11.7 %, | 45–54: 10.1 %, | 55–64: 6.6 %, |
| Rank 22: | Romania, | 25–64: 10.2 %, | 25–34: 14.9 %, | 35–44: 11.3 %, | 45–54: 9.6 %, | 55–64: 6.0 %, |
| Rank 23: | Germany, | 25–64: 9.3 %, | 25–34: 18.7 %, | 35–44: 8.5 %, | 45–54: 6.8 %, | 55–64: 4.6 %, |
| Rank 24: | Poland, | 25–64: 8.8 %, | 25–34: 13.0 %, | 35–44: 9.9 %, | 45–54: 8.1 %, | 55–64: 4.0 %, |
| Rank 25: | Croatia, | 25–64: 6.5 %, | 25–34: 13.9 %, | 35–44: 5.7 %, | 45–54: 5.2 %, | 55–64: 2.4 %, |
| Rank 26: | Bulgaria, | 25–64: 6.1 %, | 25–34: 11.6 %, | 35–44: 6.9 %, | 45–54: 4.9 %, | 55–64: 3.0 %, |
| Rank 27: | Greece, | 25–64: 5.2 %, | 25–34: 12.2 %, | 35–44: 4.5 %, | 45–54: 3.6 %, | 55–64: 2.1 %, |
By level of education
In 2025, 21.7% of people aged 25 to 64 in the EU with tertiary education took part in education or training in the last four weeks, against 5.9% of those with at most lower secondary education.
Share of people aged 25 to 64 who took part in education or training in the last four weeks, by level of education, %
2025About the data
The share of people who took part in formal or non-formal education or training in the four weeks before their survey interview, out of everyone of the same age who answered the question.
Counted: aged 25 to 64.
Eurostat: “the numerator refers to persons in a given age group who stated that they received education or training (either in the last 4 weeks or in the last 12 months preceding the survey). the denominator consists of the total population of the same age group, excluding those who did not answer to the question 'participation in education and training'.” (source)
EU Labour Force Survey (EU-LFS), a sample survey of households run by the national statistical institutes all through the year. The answer is the respondent's own account, or the account another member of the household gave for them.
How to read these numbers
How it is measured
The survey covers people usually living in private households. People in collective or institutional households are not included.
Formal education counts, meaning programmes recognised by the national education authorities. Non-formal education and training counts too, such as courses, seminars, workshops and private lessons. Both job-related and personal learning count. Guided training on the job does not count. Learning on one's own, for example from books, videos or the internet, does not count either.
Only learning in the four weeks before the interview counts. Eurostat considers the share of adults who took part in education or training in the last 12 months a more appropriate measure of adult learning. Eurostat publishes that share from the same survey every two years since 2022, in a separate dataset. It is much higher. The EU targets for adult learning are set for participation over 12 months.
France's figures have included the overseas departments Guadeloupe, Martinique, French Guiana and Réunion since 2014, and Mayotte since 2024. Cyprus's figures cover only the areas controlled by the government of the Republic of Cyprus. Spain's figures include the Canary Islands. Portugal's include the Azores and Madeira.
Eurostat says the data on educational attainment for Sweden are biased because of the composition of the sample. Sweden plans to review its method of calculation.
Low reliability
The values for people with a low level of education in Bulgaria, Croatia, Lithuania, Poland and Slovakia have low reliability (flag u), because few people in the sample belong to the group. Latvia's value is not published for the same reason. This concerns Bulgaria (2025), Croatia (2025), Lithuania (2025), Poland (2025) and Slovakia (2025).
Sources and data
Eurostat, Participation rate in education and training (last 4 weeks) (trng_lfse_01). Data updated 30 October 2026, retrieved 7 November 2026. Licence: CC BY 4.0.
Eurostat metadata · Eurostat methodology
https://ec.europa.eu/eurostat/api/dissemination/statistics/1.0/data/trng_lfse_01?format=JSON&lang=en&age=Y25-64&freq=A&geo=AT&geo=BE&geo=BG&geo=CY&geo=CZ&geo=DE&geo=DK&geo=EE&geo=EL&geo=ES&geo=EU27_2020&geo=FI&geo=FR&geo=HR&geo=HU&geo=IE&geo=IT&geo=LT&geo=LU&geo=LV&geo=MT&geo=NL&geo=PL&geo=PT&geo=RO&geo=SE&geo=SI&geo=SK&sex=T&unit=PCEurostat, Participation rate in education and training (last 4 weeks) by educational attainment level (trng_lfse_03). Data updated 30 October 2026, retrieved 7 November 2026. Licence: CC BY 4.0.
https://ec.europa.eu/eurostat/api/dissemination/statistics/1.0/data/trng_lfse_03?format=JSON&lang=en&age=Y25-64&freq=A&geo=AT&geo=BE&geo=BG&geo=CY&geo=CZ&geo=DE&geo=DK&geo=EE&geo=EL&geo=ES&geo=EU27_2020&geo=FI&geo=FR&geo=HR&geo=HU&geo=IE&geo=IT&geo=LT&geo=LU&geo=LV&geo=MT&geo=NL&geo=PL&geo=PT&geo=RO&geo=SE&geo=SI&geo=SK&isced11=ED0-2&isced11=ED3_4&isced11=ED5-8&sex=T&unit=PCRelated stories
-
Children under three in formal childcare in the EU
In Denmark, 67.2% of children under three are in formal childcare or education, against 1.8% in Slovakia (2025)
-
Young adults with a tertiary education in the EU
In Ireland, 66.8% of people aged 25 to 34 have completed tertiary education, against 23.0% in Romania (2025)
-
The gender pension gap in the EU countries
In Malta, women's average pension is 38.5% below men's, against 3.5% in Estonia (2025)
-
Hourly labour costs in the EU countries
An hour of work costs employers 5.2 times as much in Luxembourg as in Bulgaria (2024)