Holidays of four nights or more in the EU
Topic: Living conditions
In Luxembourg, 75.2% of people aged 15 or over made a personal trip of four nights or more, against 12.5% in Romania.
In 2025, 52.7% of people aged 15 or over in the EU made at least one trip of four nights or more for personal purposes. Holidays, visits to family and friends and other personal trips count. Business trips are left out.
- Figures for:
- 2025.
- Covers:
- the whole year.
- New data:
- once a year.
- Dataset updated:
- 9 October 2026.
Published 7 November 2026
The ranking
In 2025, the share of people aged 15 or over who made a personal trip of four nights or more was lowest in Romania, at 12.5%, and highest in Luxembourg, at 75.2%.
Share of people aged 15 or over who made a personal trip of four nights or more, %
2025 · with at least one trip of four nights or moreShort and long trips
For trips of one night or more, the spread across countries was slightly narrower. Romania was again the lowest, at 28.3%, and Sweden the highest, at 88.4%. The gap between Sweden and Romania was 60.1 percentage points.
Share of people aged 15 or over who made a personal trip of one night or more and of four nights or more, %
2025 · with at least one trip of four nights or more(%)
| Four nights or more | One night or more | |
|---|---|---|
| Lowest | 12.5%Romania | 28.3%Romania |
| Highest | 75.2%Luxembourg | 88.4%Sweden |
| Highest − lowest | 62.7 pp | 60.1 pp |
At home or abroad
In 2025, 17.5% of people aged 15 or over in the EU made such trips only abroad, 13.3% both at home and abroad, and 21.9% only within their own country.
Share of people aged 15 or over who made a personal trip of four nights or more, by destination, %
2025By age
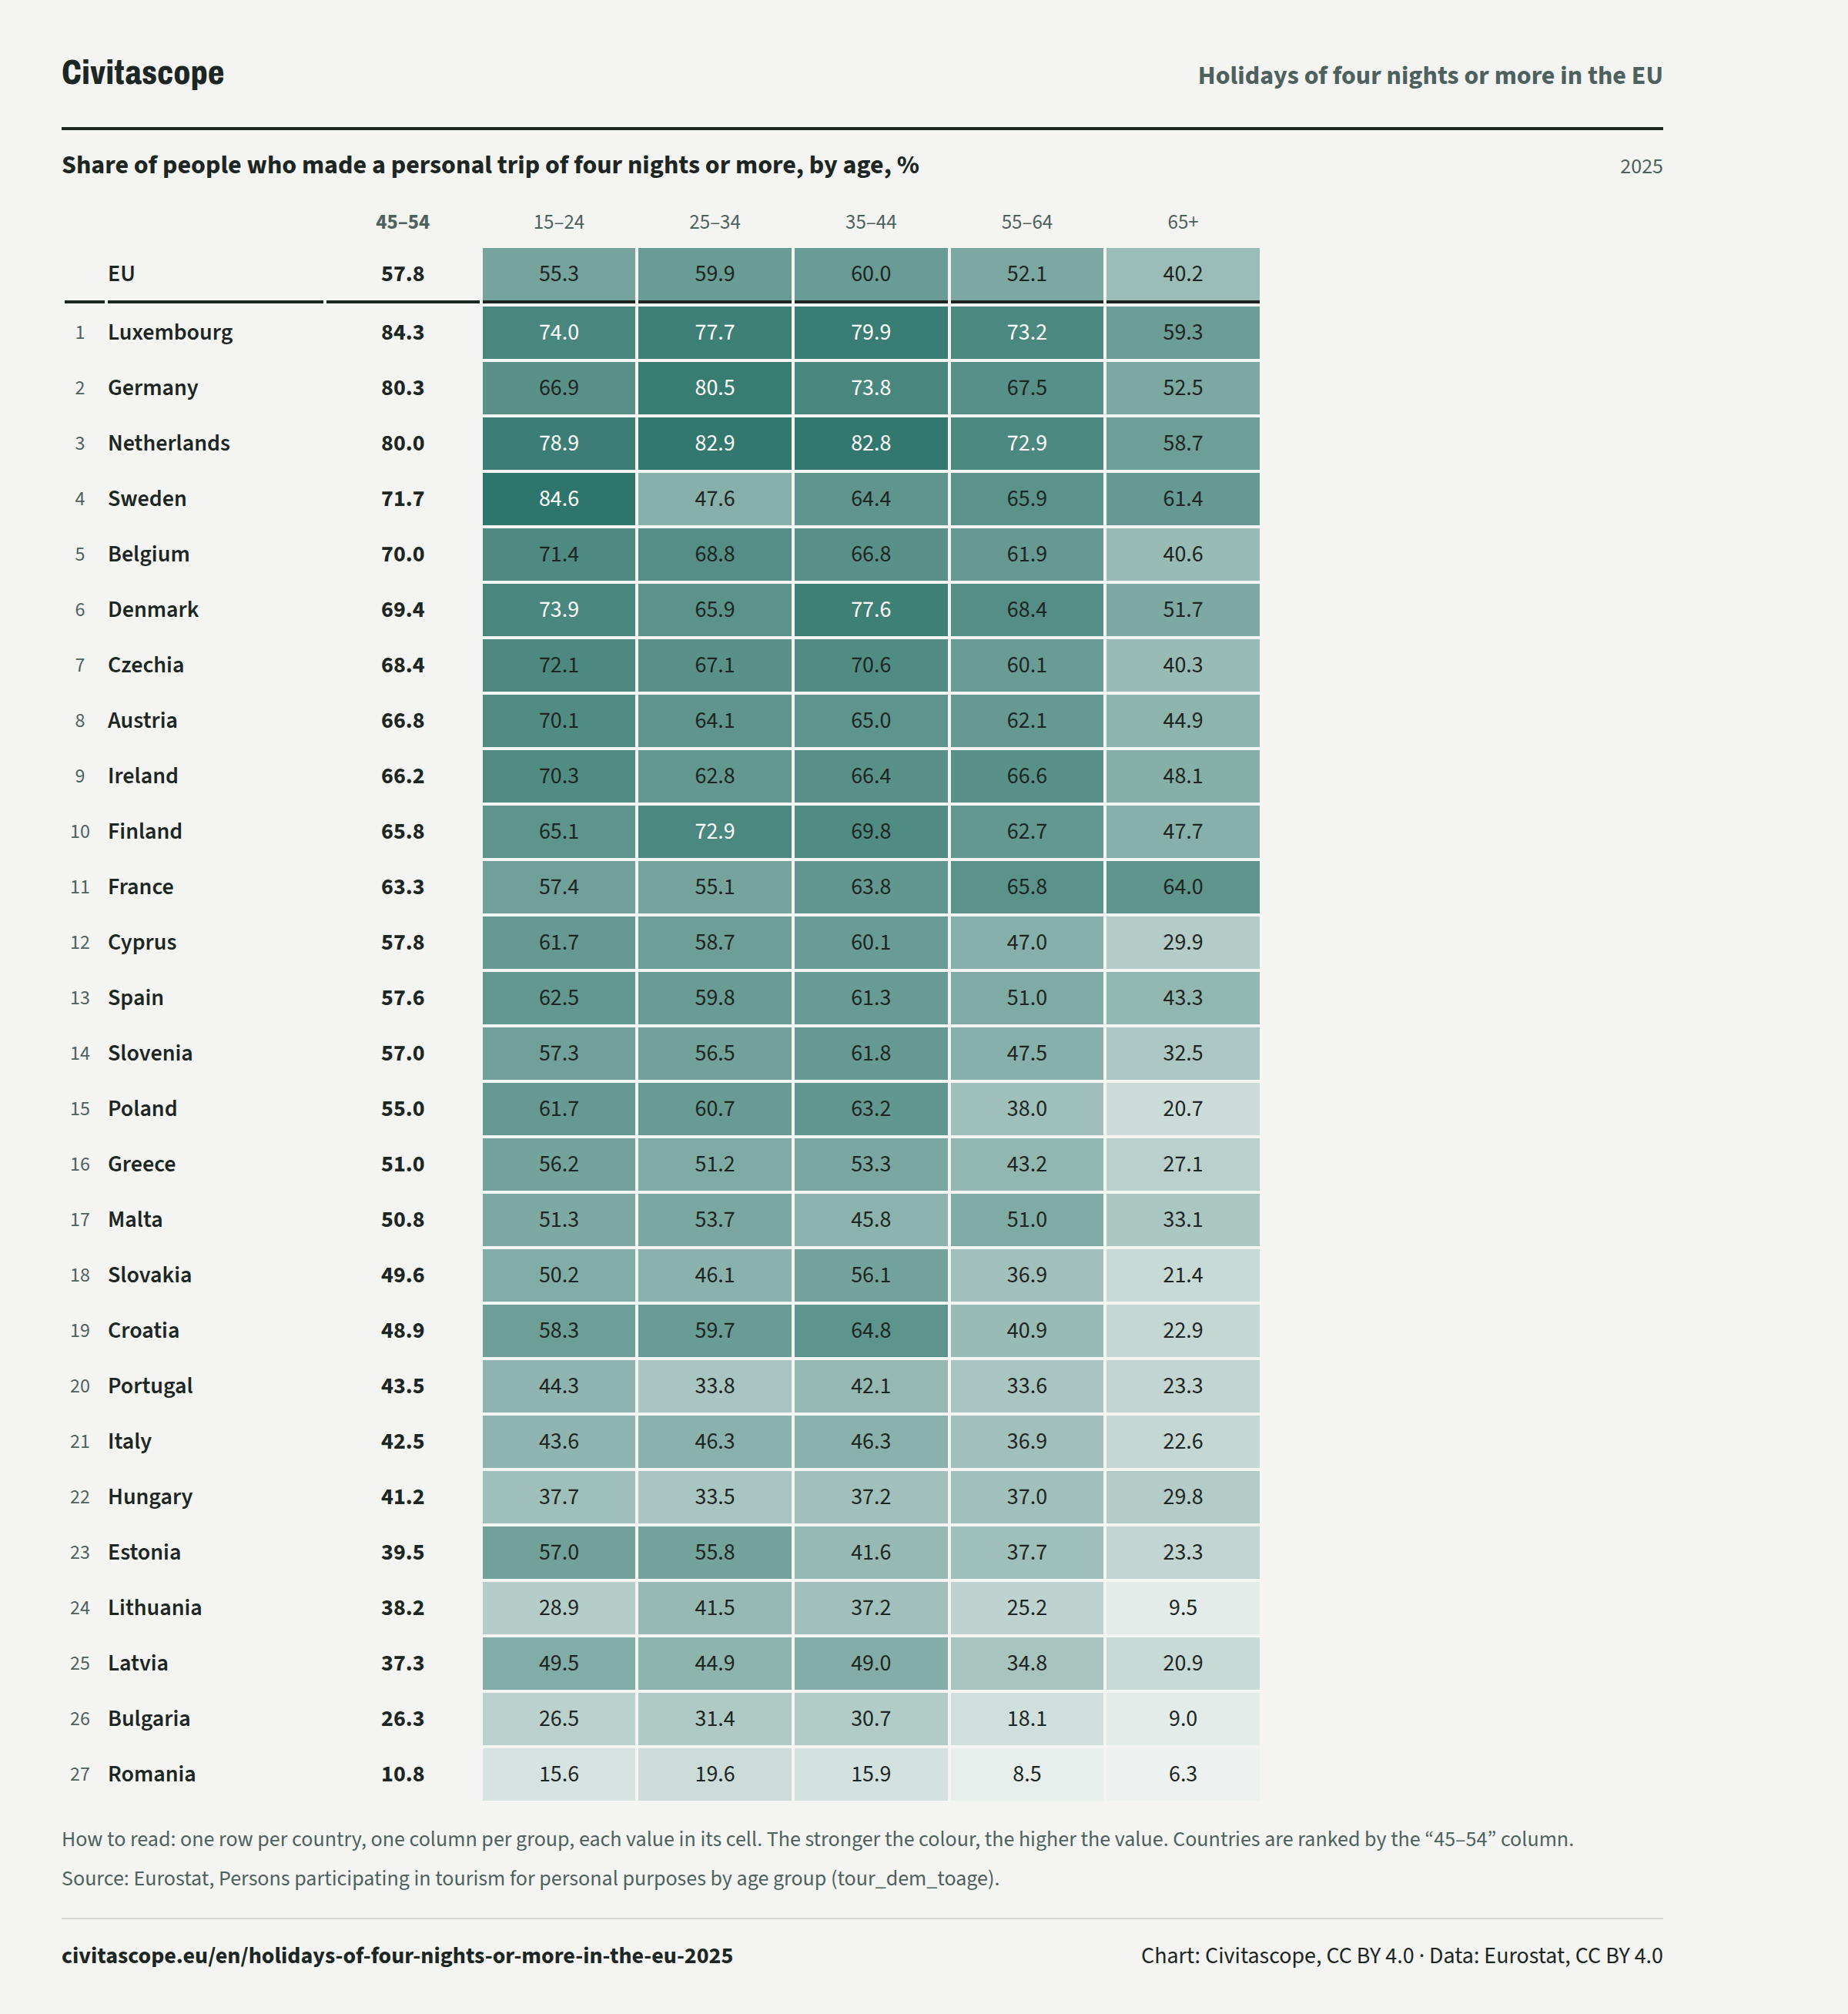
In 2025, 60.0% of people aged 35 to 44 in the EU made a personal trip of four nights or more, against 40.2% of people aged 65 or over.
Share of people who made a personal trip of four nights or more, by age, %
2025| 45–54 | 15–24 | 25–34 | 35–44 | 55–64 | 65+ | ||
|---|---|---|---|---|---|---|---|
| EU, | 45–54: 57.8 %, | 15–24: 55.3 %, | 25–34: 59.9 %, | 35–44: 60.0 %, | 55–64: 52.1 %, | 65+: 40.2 %, | |
| Rank 1: | Luxembourg, | 45–54: 84.3 %, | 15–24: 74.0 %, | 25–34: 77.7 %, | 35–44: 79.9 %, | 55–64: 73.2 %, | 65+: 59.3 %, |
| Rank 2: | Germany, | 45–54: 80.3 %, | 15–24: 66.9 %, | 25–34: 80.5 %, | 35–44: 73.8 %, | 55–64: 67.5 %, | 65+: 52.5 %, |
| Rank 3: | Netherlands, | 45–54: 80.0 %, | 15–24: 78.9 %, | 25–34: 82.9 %, | 35–44: 82.8 %, | 55–64: 72.9 %, | 65+: 58.7 %, |
| Rank 4: | Sweden, | 45–54: 71.7 %, | 15–24: 84.6 %, | 25–34: 47.6 %, | 35–44: 64.4 %, | 55–64: 65.9 %, | 65+: 61.4 %, |
| Rank 5: | Belgium, | 45–54: 70.0 %, | 15–24: 71.4 %, | 25–34: 68.8 %, | 35–44: 66.8 %, | 55–64: 61.9 %, | 65+: 40.6 %, |
| Rank 6: | Denmark, | 45–54: 69.4 %, | 15–24: 73.9 %, | 25–34: 65.9 %, | 35–44: 77.6 %, | 55–64: 68.4 %, | 65+: 51.7 %, |
| Rank 7: | Czechia, | 45–54: 68.4 %, | 15–24: 72.1 %, | 25–34: 67.1 %, | 35–44: 70.6 %, | 55–64: 60.1 %, | 65+: 40.3 %, |
| Rank 8: | Austria, | 45–54: 66.8 %, | 15–24: 70.1 %, | 25–34: 64.1 %, | 35–44: 65.0 %, | 55–64: 62.1 %, | 65+: 44.9 %, |
| Rank 9: | Ireland, | 45–54: 66.2 %, | 15–24: 70.3 %, | 25–34: 62.8 %, | 35–44: 66.4 %, | 55–64: 66.6 %, | 65+: 48.1 %, |
| Rank 10: | Finland, | 45–54: 65.8 %, | 15–24: 65.1 %, | 25–34: 72.9 %, | 35–44: 69.8 %, | 55–64: 62.7 %, | 65+: 47.7 %, |
| Rank 11: | France, | 45–54: 63.3 %, | 15–24: 57.4 %, | 25–34: 55.1 %, | 35–44: 63.8 %, | 55–64: 65.8 %, | 65+: 64.0 %, |
| Rank 12: | Cyprus, | 45–54: 57.8 %, | 15–24: 61.7 %, | 25–34: 58.7 %, | 35–44: 60.1 %, | 55–64: 47.0 %, | 65+: 29.9 %, |
| Rank 13: | Spain, | 45–54: 57.6 %, | 15–24: 62.5 %, | 25–34: 59.8 %, | 35–44: 61.3 %, | 55–64: 51.0 %, | 65+: 43.3 %, |
| Rank 14: | Slovenia, | 45–54: 57.0 %, | 15–24: 57.3 %, | 25–34: 56.5 %, | 35–44: 61.8 %, | 55–64: 47.5 %, | 65+: 32.5 %, |
| Rank 15: | Poland, | 45–54: 55.0 %, | 15–24: 61.7 %, | 25–34: 60.7 %, | 35–44: 63.2 %, | 55–64: 38.0 %, | 65+: 20.7 %, |
| Rank 16: | Greece, | 45–54: 51.0 %, | 15–24: 56.2 %, | 25–34: 51.2 %, | 35–44: 53.3 %, | 55–64: 43.2 %, | 65+: 27.1 %, |
| Rank 17: | Malta, | 45–54: 50.8 %, | 15–24: 51.3 %, | 25–34: 53.7 %, | 35–44: 45.8 %, | 55–64: 51.0 %, | 65+: 33.1 %, |
| Rank 18: | Slovakia, | 45–54: 49.6 %, | 15–24: 50.2 %, | 25–34: 46.1 %, | 35–44: 56.1 %, | 55–64: 36.9 %, | 65+: 21.4 %, |
| Rank 19: | Croatia, | 45–54: 48.9 %, | 15–24: 58.3 %, | 25–34: 59.7 %, | 35–44: 64.8 %, | 55–64: 40.9 %, | 65+: 22.9 %, |
| Rank 20: | Portugal, | 45–54: 43.5 %, | 15–24: 44.3 %, | 25–34: 33.8 %, | 35–44: 42.1 %, | 55–64: 33.6 %, | 65+: 23.3 %, |
| Rank 21: | Italy, | 45–54: 42.5 %, | 15–24: 43.6 %, | 25–34: 46.3 %, | 35–44: 46.3 %, | 55–64: 36.9 %, | 65+: 22.6 %, |
| Rank 22: | Hungary, | 45–54: 41.2 %, | 15–24: 37.7 %, | 25–34: 33.5 %, | 35–44: 37.2 %, | 55–64: 37.0 %, | 65+: 29.8 %, |
| Rank 23: | Estonia, | 45–54: 39.5 %, | 15–24: 57.0 %, | 25–34: 55.8 %, | 35–44: 41.6 %, | 55–64: 37.7 %, | 65+: 23.3 %, |
| Rank 24: | Lithuania, | 45–54: 38.2 %, | 15–24: 28.9 %, | 25–34: 41.5 %, | 35–44: 37.2 %, | 55–64: 25.2 %, | 65+: 9.5 %, |
| Rank 25: | Latvia, | 45–54: 37.3 %, | 15–24: 49.5 %, | 25–34: 44.9 %, | 35–44: 49.0 %, | 55–64: 34.8 %, | 65+: 20.9 %, |
| Rank 26: | Bulgaria, | 45–54: 26.3 %, | 15–24: 26.5 %, | 25–34: 31.4 %, | 35–44: 30.7 %, | 55–64: 18.1 %, | 65+: 9.0 %, |
| Rank 27: | Romania, | 45–54: 10.8 %, | 15–24: 15.6 %, | 25–34: 19.6 %, | 35–44: 15.9 %, | 55–64: 8.5 %, | 65+: 6.3 %, |
| 45–54 | 15–24 | 25–34 | 35–44 | ||
|---|---|---|---|---|---|
| EU, | 45–54: 57.8 %, | 15–24: 55.3 %, | 25–34: 59.9 %, | 35–44: 60.0 %, | |
| Rank 1: | Luxembourg, | 45–54: 84.3 %, | 15–24: 74.0 %, | 25–34: 77.7 %, | 35–44: 79.9 %, |
| Rank 2: | Germany, | 45–54: 80.3 %, | 15–24: 66.9 %, | 25–34: 80.5 %, | 35–44: 73.8 %, |
| Rank 3: | Netherlands, | 45–54: 80.0 %, | 15–24: 78.9 %, | 25–34: 82.9 %, | 35–44: 82.8 %, |
| Rank 4: | Sweden, | 45–54: 71.7 %, | 15–24: 84.6 %, | 25–34: 47.6 %, | 35–44: 64.4 %, |
| Rank 5: | Belgium, | 45–54: 70.0 %, | 15–24: 71.4 %, | 25–34: 68.8 %, | 35–44: 66.8 %, |
| Rank 6: | Denmark, | 45–54: 69.4 %, | 15–24: 73.9 %, | 25–34: 65.9 %, | 35–44: 77.6 %, |
| Rank 7: | Czechia, | 45–54: 68.4 %, | 15–24: 72.1 %, | 25–34: 67.1 %, | 35–44: 70.6 %, |
| Rank 8: | Austria, | 45–54: 66.8 %, | 15–24: 70.1 %, | 25–34: 64.1 %, | 35–44: 65.0 %, |
| Rank 9: | Ireland, | 45–54: 66.2 %, | 15–24: 70.3 %, | 25–34: 62.8 %, | 35–44: 66.4 %, |
| Rank 10: | Finland, | 45–54: 65.8 %, | 15–24: 65.1 %, | 25–34: 72.9 %, | 35–44: 69.8 %, |
| Rank 11: | France, | 45–54: 63.3 %, | 15–24: 57.4 %, | 25–34: 55.1 %, | 35–44: 63.8 %, |
| Rank 12: | Cyprus, | 45–54: 57.8 %, | 15–24: 61.7 %, | 25–34: 58.7 %, | 35–44: 60.1 %, |
| Rank 13: | Spain, | 45–54: 57.6 %, | 15–24: 62.5 %, | 25–34: 59.8 %, | 35–44: 61.3 %, |
| Rank 14: | Slovenia, | 45–54: 57.0 %, | 15–24: 57.3 %, | 25–34: 56.5 %, | 35–44: 61.8 %, |
| Rank 15: | Poland, | 45–54: 55.0 %, | 15–24: 61.7 %, | 25–34: 60.7 %, | 35–44: 63.2 %, |
| Rank 16: | Greece, | 45–54: 51.0 %, | 15–24: 56.2 %, | 25–34: 51.2 %, | 35–44: 53.3 %, |
| Rank 17: | Malta, | 45–54: 50.8 %, | 15–24: 51.3 %, | 25–34: 53.7 %, | 35–44: 45.8 %, |
| Rank 18: | Slovakia, | 45–54: 49.6 %, | 15–24: 50.2 %, | 25–34: 46.1 %, | 35–44: 56.1 %, |
| Rank 19: | Croatia, | 45–54: 48.9 %, | 15–24: 58.3 %, | 25–34: 59.7 %, | 35–44: 64.8 %, |
| Rank 20: | Portugal, | 45–54: 43.5 %, | 15–24: 44.3 %, | 25–34: 33.8 %, | 35–44: 42.1 %, |
| Rank 21: | Italy, | 45–54: 42.5 %, | 15–24: 43.6 %, | 25–34: 46.3 %, | 35–44: 46.3 %, |
| Rank 22: | Hungary, | 45–54: 41.2 %, | 15–24: 37.7 %, | 25–34: 33.5 %, | 35–44: 37.2 %, |
| Rank 23: | Estonia, | 45–54: 39.5 %, | 15–24: 57.0 %, | 25–34: 55.8 %, | 35–44: 41.6 %, |
| Rank 24: | Lithuania, | 45–54: 38.2 %, | 15–24: 28.9 %, | 25–34: 41.5 %, | 35–44: 37.2 %, |
| Rank 25: | Latvia, | 45–54: 37.3 %, | 15–24: 49.5 %, | 25–34: 44.9 %, | 35–44: 49.0 %, |
| Rank 26: | Bulgaria, | 45–54: 26.3 %, | 15–24: 26.5 %, | 25–34: 31.4 %, | 35–44: 30.7 %, |
| Rank 27: | Romania, | 45–54: 10.8 %, | 15–24: 15.6 %, | 25–34: 19.6 %, | 35–44: 15.9 %, |
| 45–54 | 55–64 | 65+ | ||
|---|---|---|---|---|
| EU, | 45–54: 57.8 %, | 55–64: 52.1 %, | 65+: 40.2 %, | |
| Rank 1: | Luxembourg, | 45–54: 84.3 %, | 55–64: 73.2 %, | 65+: 59.3 %, |
| Rank 2: | Germany, | 45–54: 80.3 %, | 55–64: 67.5 %, | 65+: 52.5 %, |
| Rank 3: | Netherlands, | 45–54: 80.0 %, | 55–64: 72.9 %, | 65+: 58.7 %, |
| Rank 4: | Sweden, | 45–54: 71.7 %, | 55–64: 65.9 %, | 65+: 61.4 %, |
| Rank 5: | Belgium, | 45–54: 70.0 %, | 55–64: 61.9 %, | 65+: 40.6 %, |
| Rank 6: | Denmark, | 45–54: 69.4 %, | 55–64: 68.4 %, | 65+: 51.7 %, |
| Rank 7: | Czechia, | 45–54: 68.4 %, | 55–64: 60.1 %, | 65+: 40.3 %, |
| Rank 8: | Austria, | 45–54: 66.8 %, | 55–64: 62.1 %, | 65+: 44.9 %, |
| Rank 9: | Ireland, | 45–54: 66.2 %, | 55–64: 66.6 %, | 65+: 48.1 %, |
| Rank 10: | Finland, | 45–54: 65.8 %, | 55–64: 62.7 %, | 65+: 47.7 %, |
| Rank 11: | France, | 45–54: 63.3 %, | 55–64: 65.8 %, | 65+: 64.0 %, |
| Rank 12: | Cyprus, | 45–54: 57.8 %, | 55–64: 47.0 %, | 65+: 29.9 %, |
| Rank 13: | Spain, | 45–54: 57.6 %, | 55–64: 51.0 %, | 65+: 43.3 %, |
| Rank 14: | Slovenia, | 45–54: 57.0 %, | 55–64: 47.5 %, | 65+: 32.5 %, |
| Rank 15: | Poland, | 45–54: 55.0 %, | 55–64: 38.0 %, | 65+: 20.7 %, |
| Rank 16: | Greece, | 45–54: 51.0 %, | 55–64: 43.2 %, | 65+: 27.1 %, |
| Rank 17: | Malta, | 45–54: 50.8 %, | 55–64: 51.0 %, | 65+: 33.1 %, |
| Rank 18: | Slovakia, | 45–54: 49.6 %, | 55–64: 36.9 %, | 65+: 21.4 %, |
| Rank 19: | Croatia, | 45–54: 48.9 %, | 55–64: 40.9 %, | 65+: 22.9 %, |
| Rank 20: | Portugal, | 45–54: 43.5 %, | 55–64: 33.6 %, | 65+: 23.3 %, |
| Rank 21: | Italy, | 45–54: 42.5 %, | 55–64: 36.9 %, | 65+: 22.6 %, |
| Rank 22: | Hungary, | 45–54: 41.2 %, | 55–64: 37.0 %, | 65+: 29.8 %, |
| Rank 23: | Estonia, | 45–54: 39.5 %, | 55–64: 37.7 %, | 65+: 23.3 %, |
| Rank 24: | Lithuania, | 45–54: 38.2 %, | 55–64: 25.2 %, | 65+: 9.5 %, |
| Rank 25: | Latvia, | 45–54: 37.3 %, | 55–64: 34.8 %, | 65+: 20.9 %, |
| Rank 26: | Bulgaria, | 45–54: 26.3 %, | 55–64: 18.1 %, | 65+: 9.0 %, |
| Rank 27: | Romania, | 45–54: 10.8 %, | 55–64: 8.5 %, | 65+: 6.3 %, |
About the data
The share of a country's residents aged 15 or over who made at least one tourism trip for personal purposes, with at least one night away from home, during the year.
Counted: with at least one trip of four nights or more.
Eurostat: “Number of residents, aged 15 or over, having made at least 1 trip of at least 1 overnight stay. Only trips for personal purpose are covered. A breakdown by duration and by destination of the trip is provided as well as by socio-demographic characteristics of the tourist.” (source)
National tourism surveys, mostly sample surveys of households run by the national statistical institutes, which ask residents about the trips they made. In a few countries trips abroad are counted from surveys at the border. Eurostat collects the results under an EU regulation on tourism statistics.
How to read these numbers
How it is measured
The figure is a share of the residents aged 15 or over. Children under 15 are left out of both the travellers and the base. In Finland the survey covers residents aged 15 to 84. In Sweden it has covered residents aged 15 to 74 since 2017. France's figures cover residents of metropolitan France only.
Only trips for personal purposes count. These are holidays and leisure, visits to relatives and friends, and other personal trips such as pilgrimages or health treatment. Business trips are left out.
A person counts once, however many trips they made in the year. The figure says how many people travelled, not how often they travelled.
The figure counts who travelled, whatever the reason others did not. Eurostat's statistics on income and living conditions measure who cannot afford a week's holiday away from home. That indicator comes from another survey and counts people of every age through their household's answer. Its share is different.
People answer about trips made over past months, and some trips are forgotten. Eurostat names this as the main source of error. It leads to too few trips being counted.
Denmark's value for 2025 is far higher than for the years 2018 to 2024, and Denmark has no value for 2021. Eurostat marks no break in the series. Its metadata give no reason for the change.
Luxembourg's figures for people who travelled only within the country are missing for most years. Eurostat does not publish an estimate based on too few survey answers.
Each figure is a share of the residents in that age group. In Finland the oldest group is people aged 65 to 84. In Sweden it has been people aged 65 to 74 since 2017.
Since 2023 Romania's figures for people aged 15 to 24 seem to count children under 15 as well, both among the travellers and in the base. The share for this group is not comparable with other countries or with Romania's earlier years. Romania's national metadata give the population as residents aged 15 or over. Eurostat gives no reason.
Sweden's values for people aged 15 to 34 swing widely from one year to the next, and several rest on few survey answers. Eurostat marks no break and gives no reason.
Low reliability
A value of low reliability (flag u) should be read with care. This concerns Estonia (2025) and Sweden (2025).
Sources and data
Eurostat, Persons participating in tourism for personal purposes by duration of the stay and destination (tour_dem_totot). Data updated 9 October 2026, retrieved 7 November 2026. Licence: CC BY 4.0.
Eurostat metadata · Eurostat methodology
https://ec.europa.eu/eurostat/api/dissemination/statistics/1.0/data/tour_dem_totot?format=JSON&lang=en&c_dest=WORLD&duration=N_GE4&freq=A&geo=AT&geo=BE&geo=BG&geo=CY&geo=CZ&geo=DE&geo=DK&geo=EE&geo=EL&geo=ES&geo=EU27_2020&geo=FI&geo=FR&geo=HR&geo=HU&geo=IE&geo=IT&geo=LT&geo=LU&geo=LV&geo=MT&geo=NL&geo=PL&geo=PT&geo=RO&geo=SE&geo=SI&geo=SK&unit=PC_POPEurostat, Persons participating in tourism for personal purposes by age group (tour_dem_toage). Data updated 9 October 2026, retrieved 7 November 2026. Licence: CC BY 4.0.
https://ec.europa.eu/eurostat/api/dissemination/statistics/1.0/data/tour_dem_toage?format=JSON&lang=en&age=Y15-24&age=Y25-34&age=Y35-44&age=Y45-54&age=Y55-64&age=Y_GE65&c_dest=WORLD&duration=N_GE4&freq=A&geo=AT&geo=BE&geo=BG&geo=CY&geo=CZ&geo=DE&geo=DK&geo=EE&geo=EL&geo=ES&geo=EU27_2020&geo=FI&geo=FR&geo=HR&geo=HU&geo=IE&geo=IT&geo=LT&geo=LU&geo=LV&geo=MT&geo=NL&geo=PL&geo=PT&geo=RO&geo=SE&geo=SI&geo=SK&unit=PC_POPRelated stories
-
People held in prison per 100,000 inhabitants in the EU
Per inhabitant, 3.4 times as many people are held in prison in Hungary as in Finland (2024)
-
Who cannot pay an unexpected expense in the EU
In Greece, 50.5% of people live in a household that could not pay an unexpected expense from its own resources, against 15.3% in the Netherlands (2025)
-
Making ends meet in the EU countries
In Greece, 35.0% of people live in a household that makes ends meet only with great difficulty, against 1.7% in the Netherlands (2025)
-
Behind on utility bills in the EU countries
31.9% of people in Greece could not pay their utility bills on time, against 2.2% in the Netherlands (2025)