The employment rate in the EU countries and regions
Topic: Work and income
In Malta, 83.6% of people aged 20 to 64 are employed, against 67.6% in Italy.
In 2025, 76.1% of people aged 20 to 64 in the EU were employed.
The EU aims for at least 78% of people aged 20 to 64 to be in employment by 2030.
Source of this paragraph, outside Eurostat: European Commission, The European Pillar of Social Rights Action Plan, COM(2021) 102 final, chapter 2 (retrieved 13 November 2026)
- Figures for:
- 2025.
- Covers:
- the whole year.
- New data:
- once a year.
- Dataset updated:
- 30 October 2026.
Published 13 November 2026
The ranking
Employment rate of people aged 20 to 64, %
2025 · aged 20 to 64The regions of the EU
In 2025, among the EU's 244 regions, the employment rate of people aged 20 to 64 was highest in Warszawski stołeczny (Poland), 86.9%, and lowest in Mayotte (France), 36.9%.
Employment rate of people aged 20 to 64, by NUTS 2 region, %
2025 · the EU's 244 NUTS 2 regions · aged 20 to 64- 36.9–72.5 (50 regions)
- 72.9–76.7 (48 regions)
- 76.8–79.2 (50 regions)
- 79.4–81.8 (47 regions)
- 81.9–86.9 (49 regions)
Zoom with two fingers, or with Ctrl and the scroll wheel or the buttons. Zoomed in, drag to move.
Austria77.6
- Tirol82.0%
- Salzburg81.8%
- Oberösterreich80.3%
- Vorarlberg79.9%
- Niederösterreich79.5%
- Steiermark77.8%
- Burgenland76.9%
- Kärnten76.8%
- Wien71.3%
Belgium72.8
- Prov. West-Vlaanderen79.2%
- Prov. Oost-Vlaanderen78.8%
- Prov. Vlaams-Brabant77.1%
- Prov. Antwerpen76.2%
- Prov. Limburg (BE)75.0%
- Prov. Brabant wallon74.2%
- Prov. Luxembourg (BE)73.0%
- Prov. Namur71.1%
- Prov. Liège66.0%
- Prov. Hainaut65.3%
- Région de Bruxelles-Capitale/Brussels Hoofdstedelijk Gewest63.9%
Bulgaria77.0
- Yugozapaden81.5%
- Severoiztochen79.2%
- Severen tsentralen75.0%
- Yugoiztochen75.0%
- Yuzhen tsentralen73.0%
- Severozapaden71.6%
Croatia74.4
- Grad Zagreb80.8%
- Sjeverna Hrvatska75.8%
- Jadranska Hrvatska73.8%
- Panonska Hrvatska68.4%
Cyprus81.3
- Kýpros81.3%
Czechia82.9
- Praha86.0%
- Střední Čechy84.5%
- Jihozápad83.4%
- Jihovýchod82.5%
- Střední Morava82.5%
- Severovýchod82.3%
- Moravskoslezsko80.6%
- Severozápad80.1%
Denmark79.8
- Hovedstaden82.1%
- Midtjylland79.4%
- Sjælland78.6%
- Syddanmark78.1%
- Nordjylland77.8%
Estonia81.7
- Eesti81.7%
Finland76.3
- Åland85.5%
- Helsinki-Uusimaa77.0%
- Länsi-Suomi76.9%
- Etelä-Suomi75.8%
- Pohjois- ja Itä-Suomi75.0%
France75.4
- Alsace78.4%
- Bretagne78.3%
- Centre — Val de Loire77.9%
- Pays de la Loire77.5%
- Aquitaine77.4%
- Midi-Pyrénées77.3%
- Poitou-Charentes77.2%
- Rhône-Alpes77.1%
- Auvergne77.0%
- Limousin76.8%
- Ile de France76.5%
- Basse-Normandie76.4%
- Bourgogne75.5%
- Haute-Normandie75.4%
- Provence-Alpes-Côte d’Azur74.4%
- Picardie74.3%
- Franche-Comté73.7%
- Champagne-Ardenne73.1%
- Lorraine73.1%
- Corse72.9%
- Languedoc-Roussillon72.1%
- Nord-Pas de Calais71.8%
- Martinique67.4%
- Guadeloupe61.2%
- La Réunion59.4%
- Guyane50.0%
- Mayotte36.9%
Germany81.1
- Oberbayern85.1%
- Schwaben84.3%
- Tübingen84.3%
- Dresden84.2%
- Niederbayern84.0%
- Oberpfalz84.0%
- Freiburg83.9%
- Oberfranken83.8%
- Mittelfranken83.7%
- Stuttgart83.6%
- Unterfranken83.4%
- Weser-Ems83.3%
- Trier83.0%
- Koblenz82.9%
- Karlsruhe82.6%
- Rheinhessen-Pfalz82.1%
- Kassel81.9%
- Detmold81.7%
- Lüneburg81.7%
- Brandenburg81.6%
- Chemnitz81.4%
- Thüringen81.3%
- Leipzig81.2%
- Schleswig-Holstein80.9%
- Gießen80.3%
- Mecklenburg-Vorpommern80.3%
- Münster80.2%
- Braunschweig80.0%
- Darmstadt80.0%
- Köln79.8%
- Hannover79.4%
- Sachsen-Anhalt79.2%
- Hamburg78.7%
- Saarland78.4%
- Arnsberg77.5%
- Düsseldorf76.8%
- Berlin76.7%
- Bremen74.7%
Greece71.0
- Kriti75.4%
- Peloponnisos74.1%
- Attiki73.1%
- Sterea Elláda73.0%
- Voreio Aigaio70.0%
- Notio Aigaio69.4%
- Thessalia69.4%
- Kentriki Makedonia69.1%
- Ipeiros69.0%
- Ionia Nisia68.7%
- Anatoliki Makedonia, Thraki67.6%
- Dytiki Elláda66.6%
- Dytiki Makedonia61.6%
Hungary81.1
- Budapest84.3%
- Pest83.6%
- Közép-Dunántúl83.1%
- Nyugat-Dunántúl82.2%
- Dél-Alföld81.3%
- Észak-Alföld78.2%
- Dél-Dunántúl77.3%
- Észak-Magyarország75.8%
Ireland80.2
- Eastern and Midland80.7%
- Southern80.0%
- Northern and Western79.1%
Italy67.6
- Provincia Autonoma di Bolzano/Bozen80.0%
- Valle d’Aosta/Vallée d’Aoste77.8%
- Provincia Autonoma di Trento77.6%
- Emilia-Romagna77.0%
- Toscana76.0%
- Lombardia75.1%
- Friuli-Venezia Giulia74.7%
- Veneto74.7%
- Umbria74.6%
- Piemonte74.3%
- Liguria73.8%
- Marche72.9%
- Lazio69.3%
- Abruzzo67.2%
- Molise62.3%
- Sardegna62.3%
- Basilicata61.8%
- Puglia55.2%
- Sicilia51.4%
- Campania50.8%
- Calabria50.3%
Latvia78.2
- Latvija78.2%
Lithuania80.0
- Sostinės regionas84.7%
- Vidurio ir vakarų Lietuvos regionas77.7%
Luxembourg73.6
- Luxembourg73.6%
Malta83.6
- Malta83.6%
Netherlands83.4
- Utrecht85.4%
- Zeeland84.5%
- Flevoland84.4%
- Noord-Holland84.4%
- Overijssel84.2%
- Gelderland84.1%
- Noord-Brabant84.1%
- Drenthe83.2%
- Friesland (NL)82.9%
- Zuid-Holland82.0%
- Limburg (NL)81.0%
- Groningen80.4%
Poland78.8
- Warszawski stołeczny86.9%
- Łódzkie80.8%
- Dolnośląskie80.2%
- Pomorskie80.0%
- Wielkopolskie79.8%
- Opolskie78.8%
- Kujawsko-pomorskie78.6%
- Mazowiecki regionalny78.4%
- Lubuskie78.3%
- Podlaskie77.8%
- Zachodniopomorskie77.1%
- Śląskie77.0%
- Świętokrzyskie77.0%
- Lubelskie76.8%
- Małopolskie76.7%
- Warmińsko-mazurskie75.6%
- Podkarpackie73.2%
Portugal79.6
- Grande Lisboa81.9%
- Algarve80.6%
- Centro (PT)80.5%
- Alentejo80.2%
- Península de Setúbal79.9%
- Oeste e Vale do Tejo78.8%
- Norte78.2%
- Região Autónoma da Madeira77.2%
- Região Autónoma dos Açores76.7%
Romania69.0
- Bucureşti-Ilfov81.1%
- Nord-Vest70.3%
- Centru70.0%
- Nord-Est69.1%
- Sud-Muntenia68.3%
- Vest66.5%
- Sud-Est62.1%
- Sud-Vest Oltenia61.7%
Slovakia78.1
- Bratislavský kraj84.3%
- Západné Slovensko79.5%
- Stredné Slovensko79.4%
- Východné Slovensko72.5%
Slovenia78.3
- Zahodna Slovenija79.9%
- Vzhodna Slovenija76.8%
Spain72.4
- Comunidad de Madrid77.9%
- La Rioja77.1%
- Cataluña76.4%
- Comunidad Foral de Navarra75.7%
- Aragón75.6%
- Illes Balears75.5%
- País Vasco74.7%
- Castilla y León74.3%
- Cantabria73.7%
- Galicia72.5%
- Principado de Asturias72.0%
- Comunitat Valenciana70.8%
- Castilla-La Mancha70.3%
- Región de Murcia69.5%
- Canarias67.7%
- Extremadura66.9%
- Andalucía65.8%
- Ciudad de Ceuta58.3%
- Ciudad de Melilla55.0%
Sweden81.8
- Mellersta Norrland85.0%
- Småland med öarna83.7%
- Stockholm83.5%
- Övre Norrland82.0%
- Västsverige81.7%
- Norra Mellansverige81.2%
- Sydsverige80.0%
- Östra Mellansverige79.6%
Over time
Employment rate of people aged 20 to 64 in the EU, %
2021–2025 · aged 20 to 64Between 2021 and 2025, the rate fell in 2 countries and rose in 25.
Employment rate of people aged 20 to 64, %
2021 and 2025 · ranked by 2025 · aged 20 to 64Women and men
Among women, the gap between the highest and the lowest country was wider than among women and men together. Italy was again the lowest, at 58.0%, and Estonia the highest, at 81.4%. The gap between Estonia and Italy was 23.4 percentage points.
Among men, the gap between the highest and the lowest country was much narrower than among women. Malta was the highest, at 89.1%, and Belgium the lowest, at 76.4%. The highest and the lowest were 12.7 percentage points apart.
Employment rate of people aged 20 to 64: women and men, %
2025| Everyone | Women | Men | |
|---|---|---|---|
| Lowest | 67.6%Italy | 58.0%Italy | 76.4%Belgium |
| Highest | 83.6%Malta | 81.4%Estonia | 89.1%Malta |
| Highest − lowest | 16.0 pp | 23.4 pp | 12.7 pp |
By age
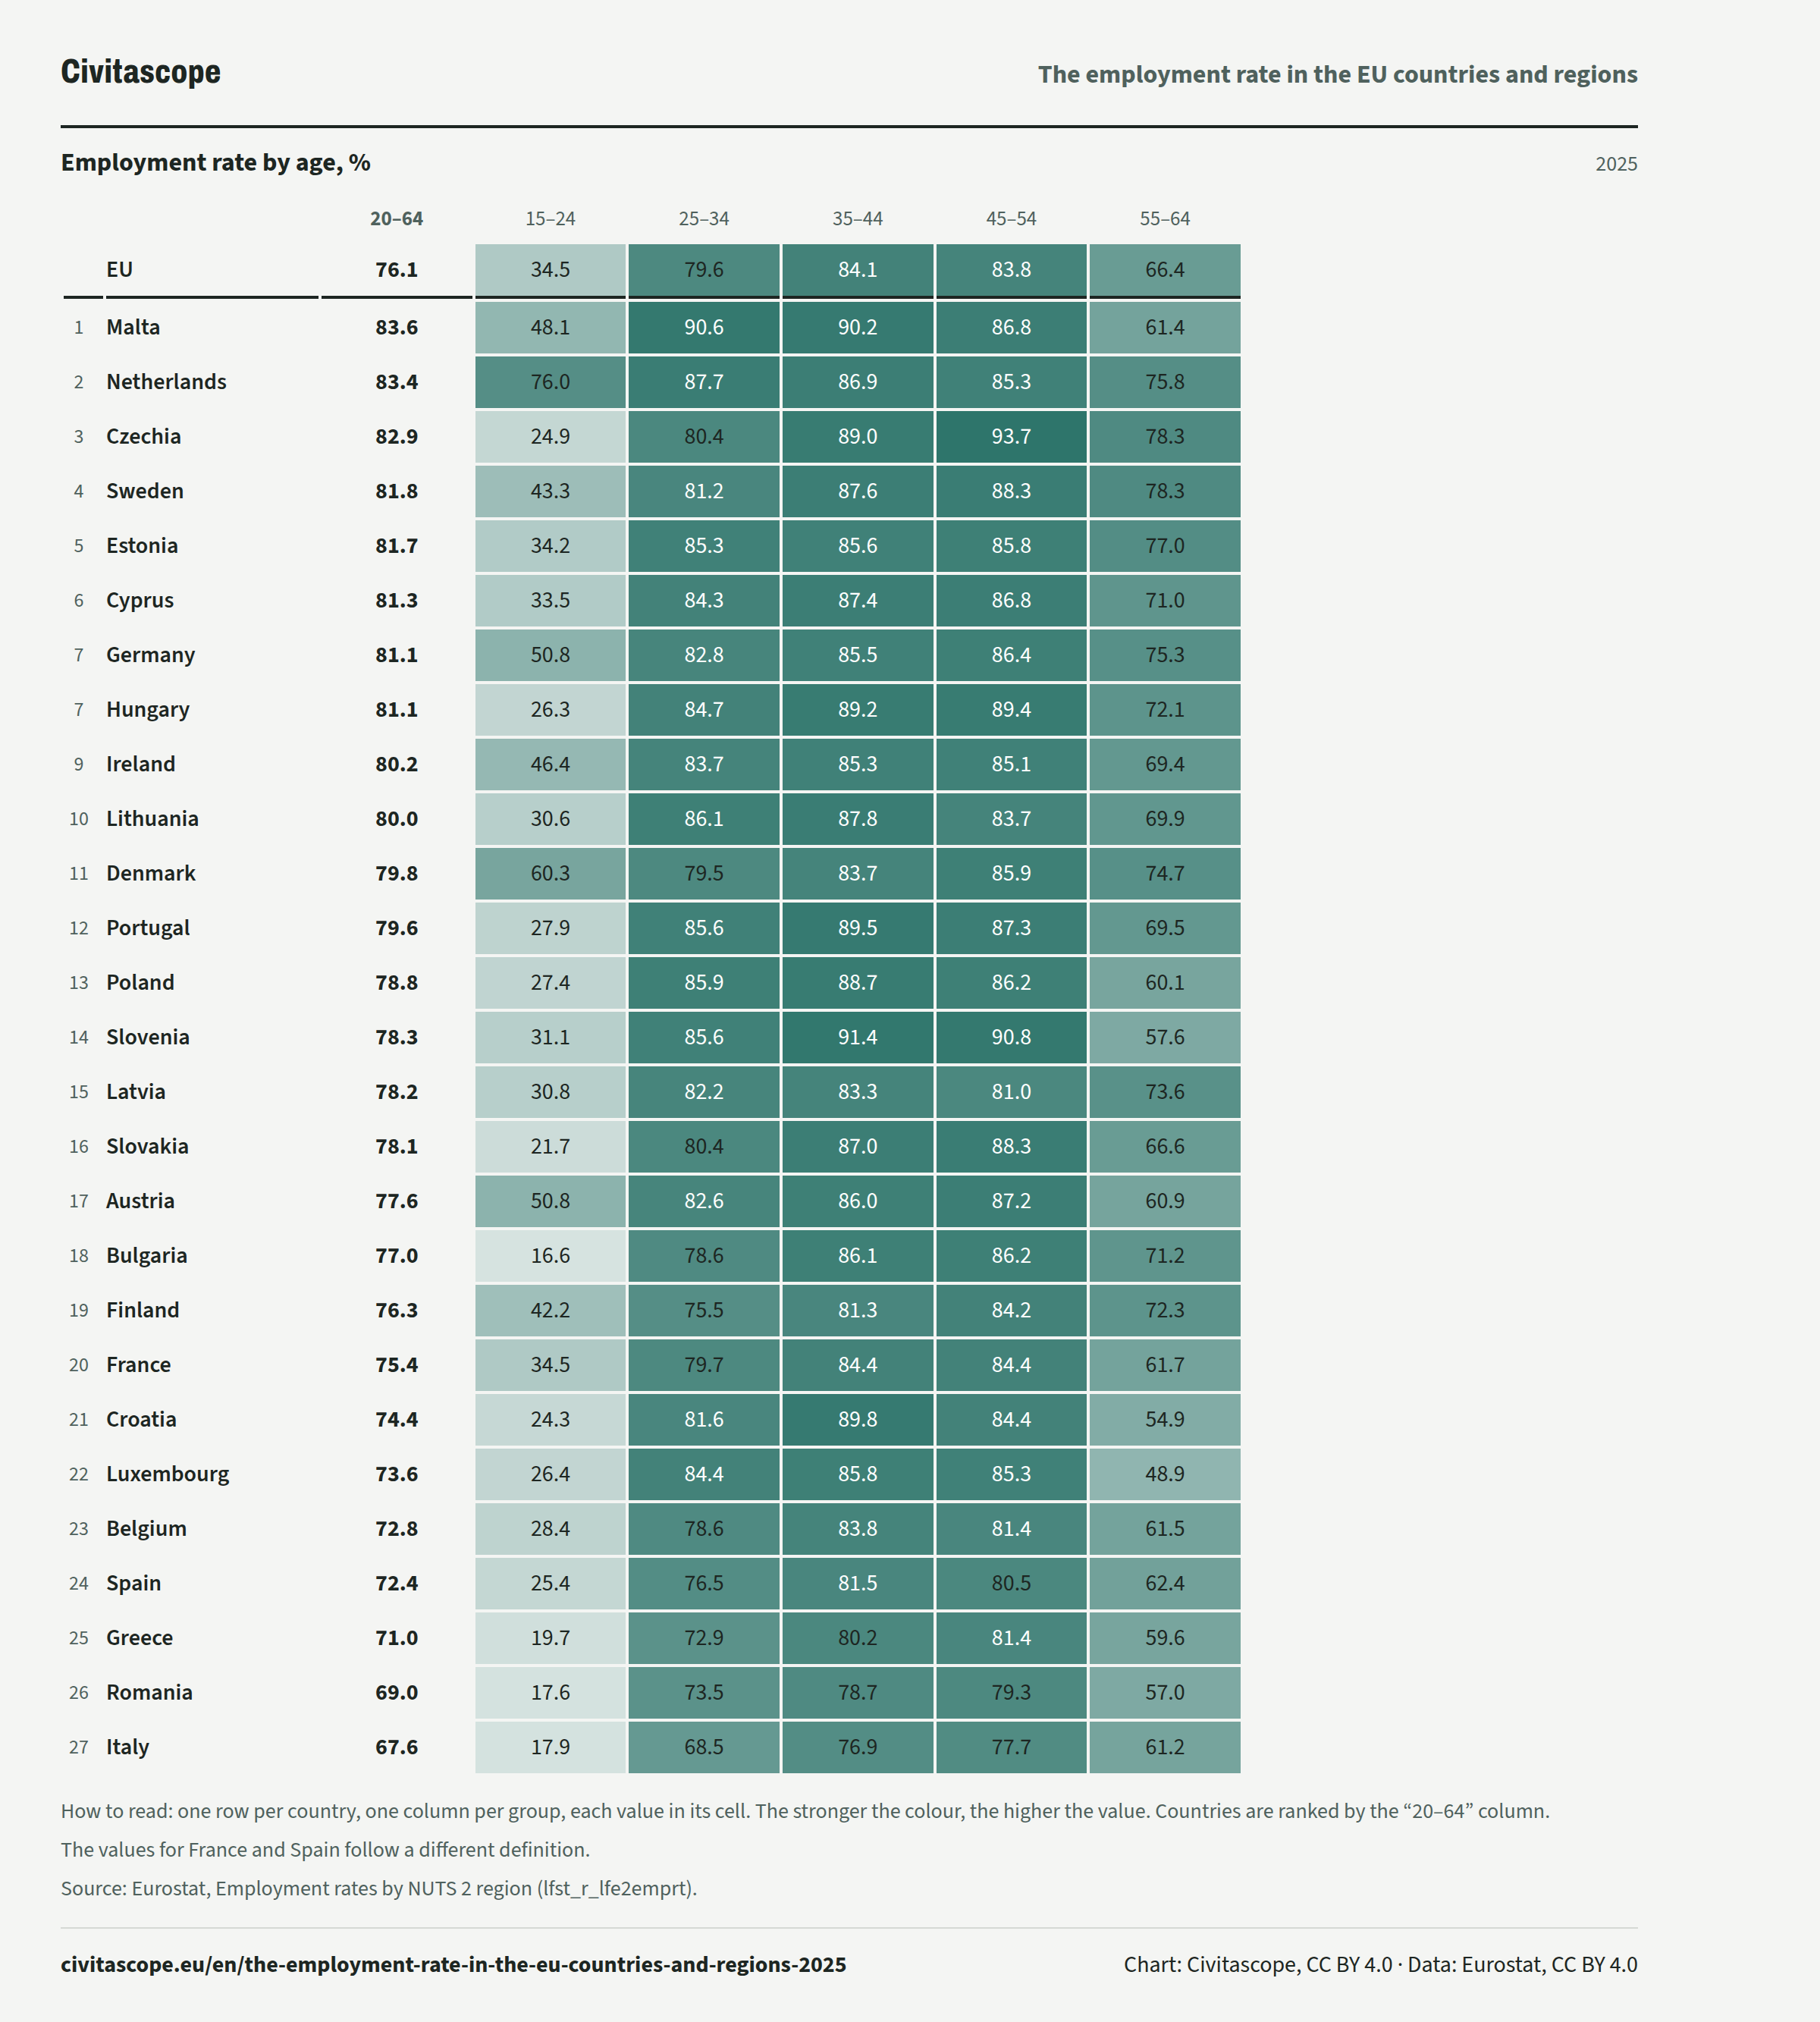
In 2025, 34.5% of people aged 15 to 24 in the EU were employed, 84.1% of those aged 35 to 44 and 66.4% of those aged 55 to 64.
Employment rate by age, %
2025| 20–64 | 15–24 | 25–34 | 35–44 | 45–54 | 55–64 | ||
|---|---|---|---|---|---|---|---|
| EU, | 20–64: 76.1%, | 15–24: 34.5%, | 25–34: 79.6%, | 35–44: 84.1%, | 45–54: 83.8%, | 55–64: 66.4%, | |
| Rank 1: | Malta, | 20–64: 83.6%, | 15–24: 48.1%, | 25–34: 90.6%, | 35–44: 90.2%, | 45–54: 86.8%, | 55–64: 61.4%, |
| Rank 2: | Netherlands, | 20–64: 83.4%, | 15–24: 76.0%, | 25–34: 87.7%, | 35–44: 86.9%, | 45–54: 85.3%, | 55–64: 75.8%, |
| Rank 3: | Czechia, | 20–64: 82.9%, | 15–24: 24.9%, | 25–34: 80.4%, | 35–44: 89.0%, | 45–54: 93.7%, | 55–64: 78.3%, |
| Rank 4: | Sweden, | 20–64: 81.8%, | 15–24: 43.3%, | 25–34: 81.2%, | 35–44: 87.6%, | 45–54: 88.3%, | 55–64: 78.3%, |
| Rank 5: | Estonia, | 20–64: 81.7%, | 15–24: 34.2%, | 25–34: 85.3%, | 35–44: 85.6%, | 45–54: 85.8%, | 55–64: 77.0%, |
| Rank 6: | Cyprus, | 20–64: 81.3%, | 15–24: 33.5%, | 25–34: 84.3%, | 35–44: 87.4%, | 45–54: 86.8%, | 55–64: 71.0%, |
| Rank 7: | Germany, | 20–64: 81.1%, | 15–24: 50.8%, | 25–34: 82.8%, | 35–44: 85.5%, | 45–54: 86.4%, | 55–64: 75.3%, |
| Rank 7: | Hungary, | 20–64: 81.1%, | 15–24: 26.3%, | 25–34: 84.7%, | 35–44: 89.2%, | 45–54: 89.4%, | 55–64: 72.1%, |
| Rank 9: | Ireland, | 20–64: 80.2%, | 15–24: 46.4%, | 25–34: 83.7%, | 35–44: 85.3%, | 45–54: 85.1%, | 55–64: 69.4%, |
| Rank 10: | Lithuania, | 20–64: 80.0%, | 15–24: 30.6%, | 25–34: 86.1%, | 35–44: 87.8%, | 45–54: 83.7%, | 55–64: 69.9%, |
| Rank 11: | Denmark, | 20–64: 79.8%, | 15–24: 60.3%, | 25–34: 79.5%, | 35–44: 83.7%, | 45–54: 85.9%, | 55–64: 74.7%, |
| Rank 12: | Portugal, | 20–64: 79.6%, | 15–24: 27.9%, | 25–34: 85.6%, | 35–44: 89.5%, | 45–54: 87.3%, | 55–64: 69.5%, |
| Rank 13: | Poland, | 20–64: 78.8%, | 15–24: 27.4%, | 25–34: 85.9%, | 35–44: 88.7%, | 45–54: 86.2%, | 55–64: 60.1%, |
| Rank 14: | Slovenia, | 20–64: 78.3%, | 15–24: 31.1%, | 25–34: 85.6%, | 35–44: 91.4%, | 45–54: 90.8%, | 55–64: 57.6%, |
| Rank 15: | Latvia, | 20–64: 78.2%, | 15–24: 30.8%, | 25–34: 82.2%, | 35–44: 83.3%, | 45–54: 81.0%, | 55–64: 73.6%, |
| Rank 16: | Slovakia, | 20–64: 78.1%, | 15–24: 21.7%, | 25–34: 80.4%, | 35–44: 87.0%, | 45–54: 88.3%, | 55–64: 66.6%, |
| Rank 17: | Austria, | 20–64: 77.6%, | 15–24: 50.8%, | 25–34: 82.6%, | 35–44: 86.0%, | 45–54: 87.2%, | 55–64: 60.9%, |
| Rank 18: | Bulgaria, | 20–64: 77.0%, | 15–24: 16.6%, | 25–34: 78.6%, | 35–44: 86.1%, | 45–54: 86.2%, | 55–64: 71.2%, |
| Rank 19: | Finland, | 20–64: 76.3%, | 15–24: 42.2%, | 25–34: 75.5%, | 35–44: 81.3%, | 45–54: 84.2%, | 55–64: 72.3%, |
| Rank 20: | France, | 20–64: 75.4%, | 15–24: 34.5%, | 25–34: 79.7%, | 35–44: 84.4%, | 45–54: 84.4%, | 55–64: 61.7%, |
| Rank 21: | Croatia, | 20–64: 74.4%, | 15–24: 24.3%, | 25–34: 81.6%, | 35–44: 89.8%, | 45–54: 84.4%, | 55–64: 54.9%, |
| Rank 22: | Luxembourg, | 20–64: 73.6%, | 15–24: 26.4%, | 25–34: 84.4%, | 35–44: 85.8%, | 45–54: 85.3%, | 55–64: 48.9%, |
| Rank 23: | Belgium, | 20–64: 72.8%, | 15–24: 28.4%, | 25–34: 78.6%, | 35–44: 83.8%, | 45–54: 81.4%, | 55–64: 61.5%, |
| Rank 24: | Spain, | 20–64: 72.4%, | 15–24: 25.4%, | 25–34: 76.5%, | 35–44: 81.5%, | 45–54: 80.5%, | 55–64: 62.4%, |
| Rank 25: | Greece, | 20–64: 71.0%, | 15–24: 19.7%, | 25–34: 72.9%, | 35–44: 80.2%, | 45–54: 81.4%, | 55–64: 59.6%, |
| Rank 26: | Romania, | 20–64: 69.0%, | 15–24: 17.6%, | 25–34: 73.5%, | 35–44: 78.7%, | 45–54: 79.3%, | 55–64: 57.0%, |
| Rank 27: | Italy, | 20–64: 67.6%, | 15–24: 17.9%, | 25–34: 68.5%, | 35–44: 76.9%, | 45–54: 77.7%, | 55–64: 61.2%, |
| 20–64 | 15–24 | 25–34 | 35–44 | ||
|---|---|---|---|---|---|
| EU, | 20–64: 76.1%, | 15–24: 34.5%, | 25–34: 79.6%, | 35–44: 84.1%, | |
| Rank 1: | Malta, | 20–64: 83.6%, | 15–24: 48.1%, | 25–34: 90.6%, | 35–44: 90.2%, |
| Rank 2: | Netherlands, | 20–64: 83.4%, | 15–24: 76.0%, | 25–34: 87.7%, | 35–44: 86.9%, |
| Rank 3: | Czechia, | 20–64: 82.9%, | 15–24: 24.9%, | 25–34: 80.4%, | 35–44: 89.0%, |
| Rank 4: | Sweden, | 20–64: 81.8%, | 15–24: 43.3%, | 25–34: 81.2%, | 35–44: 87.6%, |
| Rank 5: | Estonia, | 20–64: 81.7%, | 15–24: 34.2%, | 25–34: 85.3%, | 35–44: 85.6%, |
| Rank 6: | Cyprus, | 20–64: 81.3%, | 15–24: 33.5%, | 25–34: 84.3%, | 35–44: 87.4%, |
| Rank 7: | Germany, | 20–64: 81.1%, | 15–24: 50.8%, | 25–34: 82.8%, | 35–44: 85.5%, |
| Rank 7: | Hungary, | 20–64: 81.1%, | 15–24: 26.3%, | 25–34: 84.7%, | 35–44: 89.2%, |
| Rank 9: | Ireland, | 20–64: 80.2%, | 15–24: 46.4%, | 25–34: 83.7%, | 35–44: 85.3%, |
| Rank 10: | Lithuania, | 20–64: 80.0%, | 15–24: 30.6%, | 25–34: 86.1%, | 35–44: 87.8%, |
| Rank 11: | Denmark, | 20–64: 79.8%, | 15–24: 60.3%, | 25–34: 79.5%, | 35–44: 83.7%, |
| Rank 12: | Portugal, | 20–64: 79.6%, | 15–24: 27.9%, | 25–34: 85.6%, | 35–44: 89.5%, |
| Rank 13: | Poland, | 20–64: 78.8%, | 15–24: 27.4%, | 25–34: 85.9%, | 35–44: 88.7%, |
| Rank 14: | Slovenia, | 20–64: 78.3%, | 15–24: 31.1%, | 25–34: 85.6%, | 35–44: 91.4%, |
| Rank 15: | Latvia, | 20–64: 78.2%, | 15–24: 30.8%, | 25–34: 82.2%, | 35–44: 83.3%, |
| Rank 16: | Slovakia, | 20–64: 78.1%, | 15–24: 21.7%, | 25–34: 80.4%, | 35–44: 87.0%, |
| Rank 17: | Austria, | 20–64: 77.6%, | 15–24: 50.8%, | 25–34: 82.6%, | 35–44: 86.0%, |
| Rank 18: | Bulgaria, | 20–64: 77.0%, | 15–24: 16.6%, | 25–34: 78.6%, | 35–44: 86.1%, |
| Rank 19: | Finland, | 20–64: 76.3%, | 15–24: 42.2%, | 25–34: 75.5%, | 35–44: 81.3%, |
| Rank 20: | France, | 20–64: 75.4%, | 15–24: 34.5%, | 25–34: 79.7%, | 35–44: 84.4%, |
| Rank 21: | Croatia, | 20–64: 74.4%, | 15–24: 24.3%, | 25–34: 81.6%, | 35–44: 89.8%, |
| Rank 22: | Luxembourg, | 20–64: 73.6%, | 15–24: 26.4%, | 25–34: 84.4%, | 35–44: 85.8%, |
| Rank 23: | Belgium, | 20–64: 72.8%, | 15–24: 28.4%, | 25–34: 78.6%, | 35–44: 83.8%, |
| Rank 24: | Spain, | 20–64: 72.4%, | 15–24: 25.4%, | 25–34: 76.5%, | 35–44: 81.5%, |
| Rank 25: | Greece, | 20–64: 71.0%, | 15–24: 19.7%, | 25–34: 72.9%, | 35–44: 80.2%, |
| Rank 26: | Romania, | 20–64: 69.0%, | 15–24: 17.6%, | 25–34: 73.5%, | 35–44: 78.7%, |
| Rank 27: | Italy, | 20–64: 67.6%, | 15–24: 17.9%, | 25–34: 68.5%, | 35–44: 76.9%, |
| 20–64 | 45–54 | 55–64 | ||
|---|---|---|---|---|
| EU, | 20–64: 76.1%, | 45–54: 83.8%, | 55–64: 66.4%, | |
| Rank 1: | Malta, | 20–64: 83.6%, | 45–54: 86.8%, | 55–64: 61.4%, |
| Rank 2: | Netherlands, | 20–64: 83.4%, | 45–54: 85.3%, | 55–64: 75.8%, |
| Rank 3: | Czechia, | 20–64: 82.9%, | 45–54: 93.7%, | 55–64: 78.3%, |
| Rank 4: | Sweden, | 20–64: 81.8%, | 45–54: 88.3%, | 55–64: 78.3%, |
| Rank 5: | Estonia, | 20–64: 81.7%, | 45–54: 85.8%, | 55–64: 77.0%, |
| Rank 6: | Cyprus, | 20–64: 81.3%, | 45–54: 86.8%, | 55–64: 71.0%, |
| Rank 7: | Germany, | 20–64: 81.1%, | 45–54: 86.4%, | 55–64: 75.3%, |
| Rank 7: | Hungary, | 20–64: 81.1%, | 45–54: 89.4%, | 55–64: 72.1%, |
| Rank 9: | Ireland, | 20–64: 80.2%, | 45–54: 85.1%, | 55–64: 69.4%, |
| Rank 10: | Lithuania, | 20–64: 80.0%, | 45–54: 83.7%, | 55–64: 69.9%, |
| Rank 11: | Denmark, | 20–64: 79.8%, | 45–54: 85.9%, | 55–64: 74.7%, |
| Rank 12: | Portugal, | 20–64: 79.6%, | 45–54: 87.3%, | 55–64: 69.5%, |
| Rank 13: | Poland, | 20–64: 78.8%, | 45–54: 86.2%, | 55–64: 60.1%, |
| Rank 14: | Slovenia, | 20–64: 78.3%, | 45–54: 90.8%, | 55–64: 57.6%, |
| Rank 15: | Latvia, | 20–64: 78.2%, | 45–54: 81.0%, | 55–64: 73.6%, |
| Rank 16: | Slovakia, | 20–64: 78.1%, | 45–54: 88.3%, | 55–64: 66.6%, |
| Rank 17: | Austria, | 20–64: 77.6%, | 45–54: 87.2%, | 55–64: 60.9%, |
| Rank 18: | Bulgaria, | 20–64: 77.0%, | 45–54: 86.2%, | 55–64: 71.2%, |
| Rank 19: | Finland, | 20–64: 76.3%, | 45–54: 84.2%, | 55–64: 72.3%, |
| Rank 20: | France, | 20–64: 75.4%, | 45–54: 84.4%, | 55–64: 61.7%, |
| Rank 21: | Croatia, | 20–64: 74.4%, | 45–54: 84.4%, | 55–64: 54.9%, |
| Rank 22: | Luxembourg, | 20–64: 73.6%, | 45–54: 85.3%, | 55–64: 48.9%, |
| Rank 23: | Belgium, | 20–64: 72.8%, | 45–54: 81.4%, | 55–64: 61.5%, |
| Rank 24: | Spain, | 20–64: 72.4%, | 45–54: 80.5%, | 55–64: 62.4%, |
| Rank 25: | Greece, | 20–64: 71.0%, | 45–54: 81.4%, | 55–64: 59.6%, |
| Rank 26: | Romania, | 20–64: 69.0%, | 45–54: 79.3%, | 55–64: 57.0%, |
| Rank 27: | Italy, | 20–64: 67.6%, | 45–54: 77.7%, | 55–64: 61.2%, |
About the data
The share of people in an age group who are employed, by NUTS 2 region.
Counted: aged 20 to 64.
Eurostat: “The employment rate is the percentage of employed persons in relation to the comparable total population.” (source)
EU Labour Force Survey (EU-LFS), a sample survey of households run by the national statistical institutes every quarter. The regional figures are averages of the year's four quarters.
How to read these numbers
How it is measured
The survey covers people usually living in private households. People in collective or institutional households are not included.
People count as employed if they worked for at least one hour for pay, profit or family gain in the survey week, or had a job from which they were temporarily absent.
The regions follow NUTS 2024 back to 2019. Portugal's and the Netherlands' new regions have values from 2019, and their old regions end in 2018.
France's figures have included the overseas departments Guadeloupe, Martinique, French Guiana and Réunion since 2014, and Mayotte since 2024. Cyprus's figures cover only the areas controlled by the government of the Republic of Cyprus. Spain's figures include the Canary Islands, Ceuta and Melilla. Portugal's include the Azores and Madeira.
Different definitions
Since 2021, every value for Spain and France and their regions is marked by Eurostat as following a different definition (flag d). Both countries still use the rules of 2020 and before to decide whether people on temporary lay-off count as employed. This concerns France (2021, 2025) and Spain (2021, 2025).
Flag d also concerns the regions of France (2025) and the regions of Spain (2025).
Breaks in the series
A break in the series (flag b) means that a value is not fully comparable with the periods before it. This concerns Bulgaria (2024), Denmark (2023) and France (2024).
Low reliability
A value of low reliability (flag u) should be read with care. This concerns the regions of France (2025).
Sources and data
Eurostat, Employment rates by NUTS 2 region (lfst_r_lfe2emprt). Data updated 30 October 2026, retrieved 13 November 2026. Licence: CC BY 4.0.
Eurostat metadata · Eurostat methodology
https://ec.europa.eu/eurostat/api/dissemination/statistics/1.0/data/lfst_r_lfe2emprt?format=JSON&lang=en&age=Y20-64&freq=A&geo=AT&geo=BE&geo=BG&geo=CY&geo=CZ&geo=DE&geo=DK&geo=EE&geo=EL&geo=ES&geo=EU27_2020&geo=FI&geo=FR&geo=HR&geo=HU&geo=IE&geo=IT&geo=LT&geo=LU&geo=LV&geo=MT&geo=NL&geo=PL&geo=PT&geo=RO&geo=SE&geo=SI&geo=SK&sex=T&unit=PCReport an error: contact [at] civitascope.eu
Related stories
-
Employees on a temporary contract in the EU
In the Netherlands, 25.8% of employees have a temporary contract, against 1.8% in Lithuania (2025)
-
Who usually works on Sundays in the EU
In Malta, 21.7% of employed people usually work on Sundays, against 2.7% in Lithuania (2025)
-
Household income per inhabitant in the EU regions
In Luxembourg, the net primary income of households was 36,200 PPS per inhabitant, against 13,200 PPS per inhabitant in Bulgaria (2023)
-
Net annual earnings of an average single worker in the EU
Adjusted for price levels, a single worker on the average wage takes home 2.0 times as much in Luxembourg as in Hungary (2025)