Employees on a temporary contract in the EU
Topic: Work and income
In the Netherlands, 25.8% of employees have a temporary contract, against 1.8% in Lithuania.
In 2025, 12.6% of employees aged 15 to 64 in the EU had a temporary contract. Their main job ends on a set date, at the end of a task or when the employee they replace returns.
- Figures for:
- 2025.
- Covers:
- the whole year.
- New data:
- once a year.
- Dataset updated:
- 30 October 2026.
Published 13 November 2026
The ranking
In 2025, the share of employees on a temporary contract was lowest in Lithuania, at 1.8%, and highest in the Netherlands, at 25.8%.
Share of employees on a temporary contract, %
2025 · aged 15 to 64Over time
Share of employees on a temporary contract in the EU, %
2021–2025 · aged 15 to 64Between 2021 and 2025, the share fell in 17 countries and rose in 9. In Luxembourg, it was the same in 2025 as in 2021.
Share of employees on a temporary contract, %
2021 and 2025 · ranked by 2025 · aged 15 to 64Women and men
Among men, the gap between the highest and the lowest country was slightly narrower than among all employees. The Netherlands was again the highest, at 24.2%, and Lithuania again the lowest, at 1.9%. The gap between the highest and the lowest was 22.3 percentage points.
Among women, the gap between the highest and the lowest country was wider than among men. The Netherlands was again the highest, at 27.5%, and Romania the lowest, at 1.1%. The gap between the Netherlands and Romania was 26.4 percentage points.
Share of employees on a temporary contract: men and women, %
2025| Everyone | Men | Women | |
|---|---|---|---|
| Lowest | 1.8%Lithuania | 1.9%Lithuania | 1.1%Romania |
| Highest | 25.8%the Netherlands | 24.2%the Netherlands | 27.5%the Netherlands |
| Highest − lowest | 24.0 pp | 22.3 pp | 26.4 pp |
By citizenship
In 2025, among citizens of the country, the share was highest in the Netherlands, at 24.9%, and lowest in Lithuania, at 1.8%.
Among non-EU citizens, it was highest in the Netherlands, at 46.7%, and lowest in Estonia, at 4.0%.
Share of employees on a temporary contract: citizens of the country and non-EU citizens, %
2025| Everyone | Citizens of the country | Non-EU citizens | |
|---|---|---|---|
| Lowest | 1.8%Lithuania | 1.8%Lithuania | 4.0%Estonia |
| Highest | 25.8%the Netherlands | 24.9%the Netherlands | 46.7%the Netherlands |
| Highest − lowest | 24.0 pp | 23.1 pp | 42.7 pp |
By age
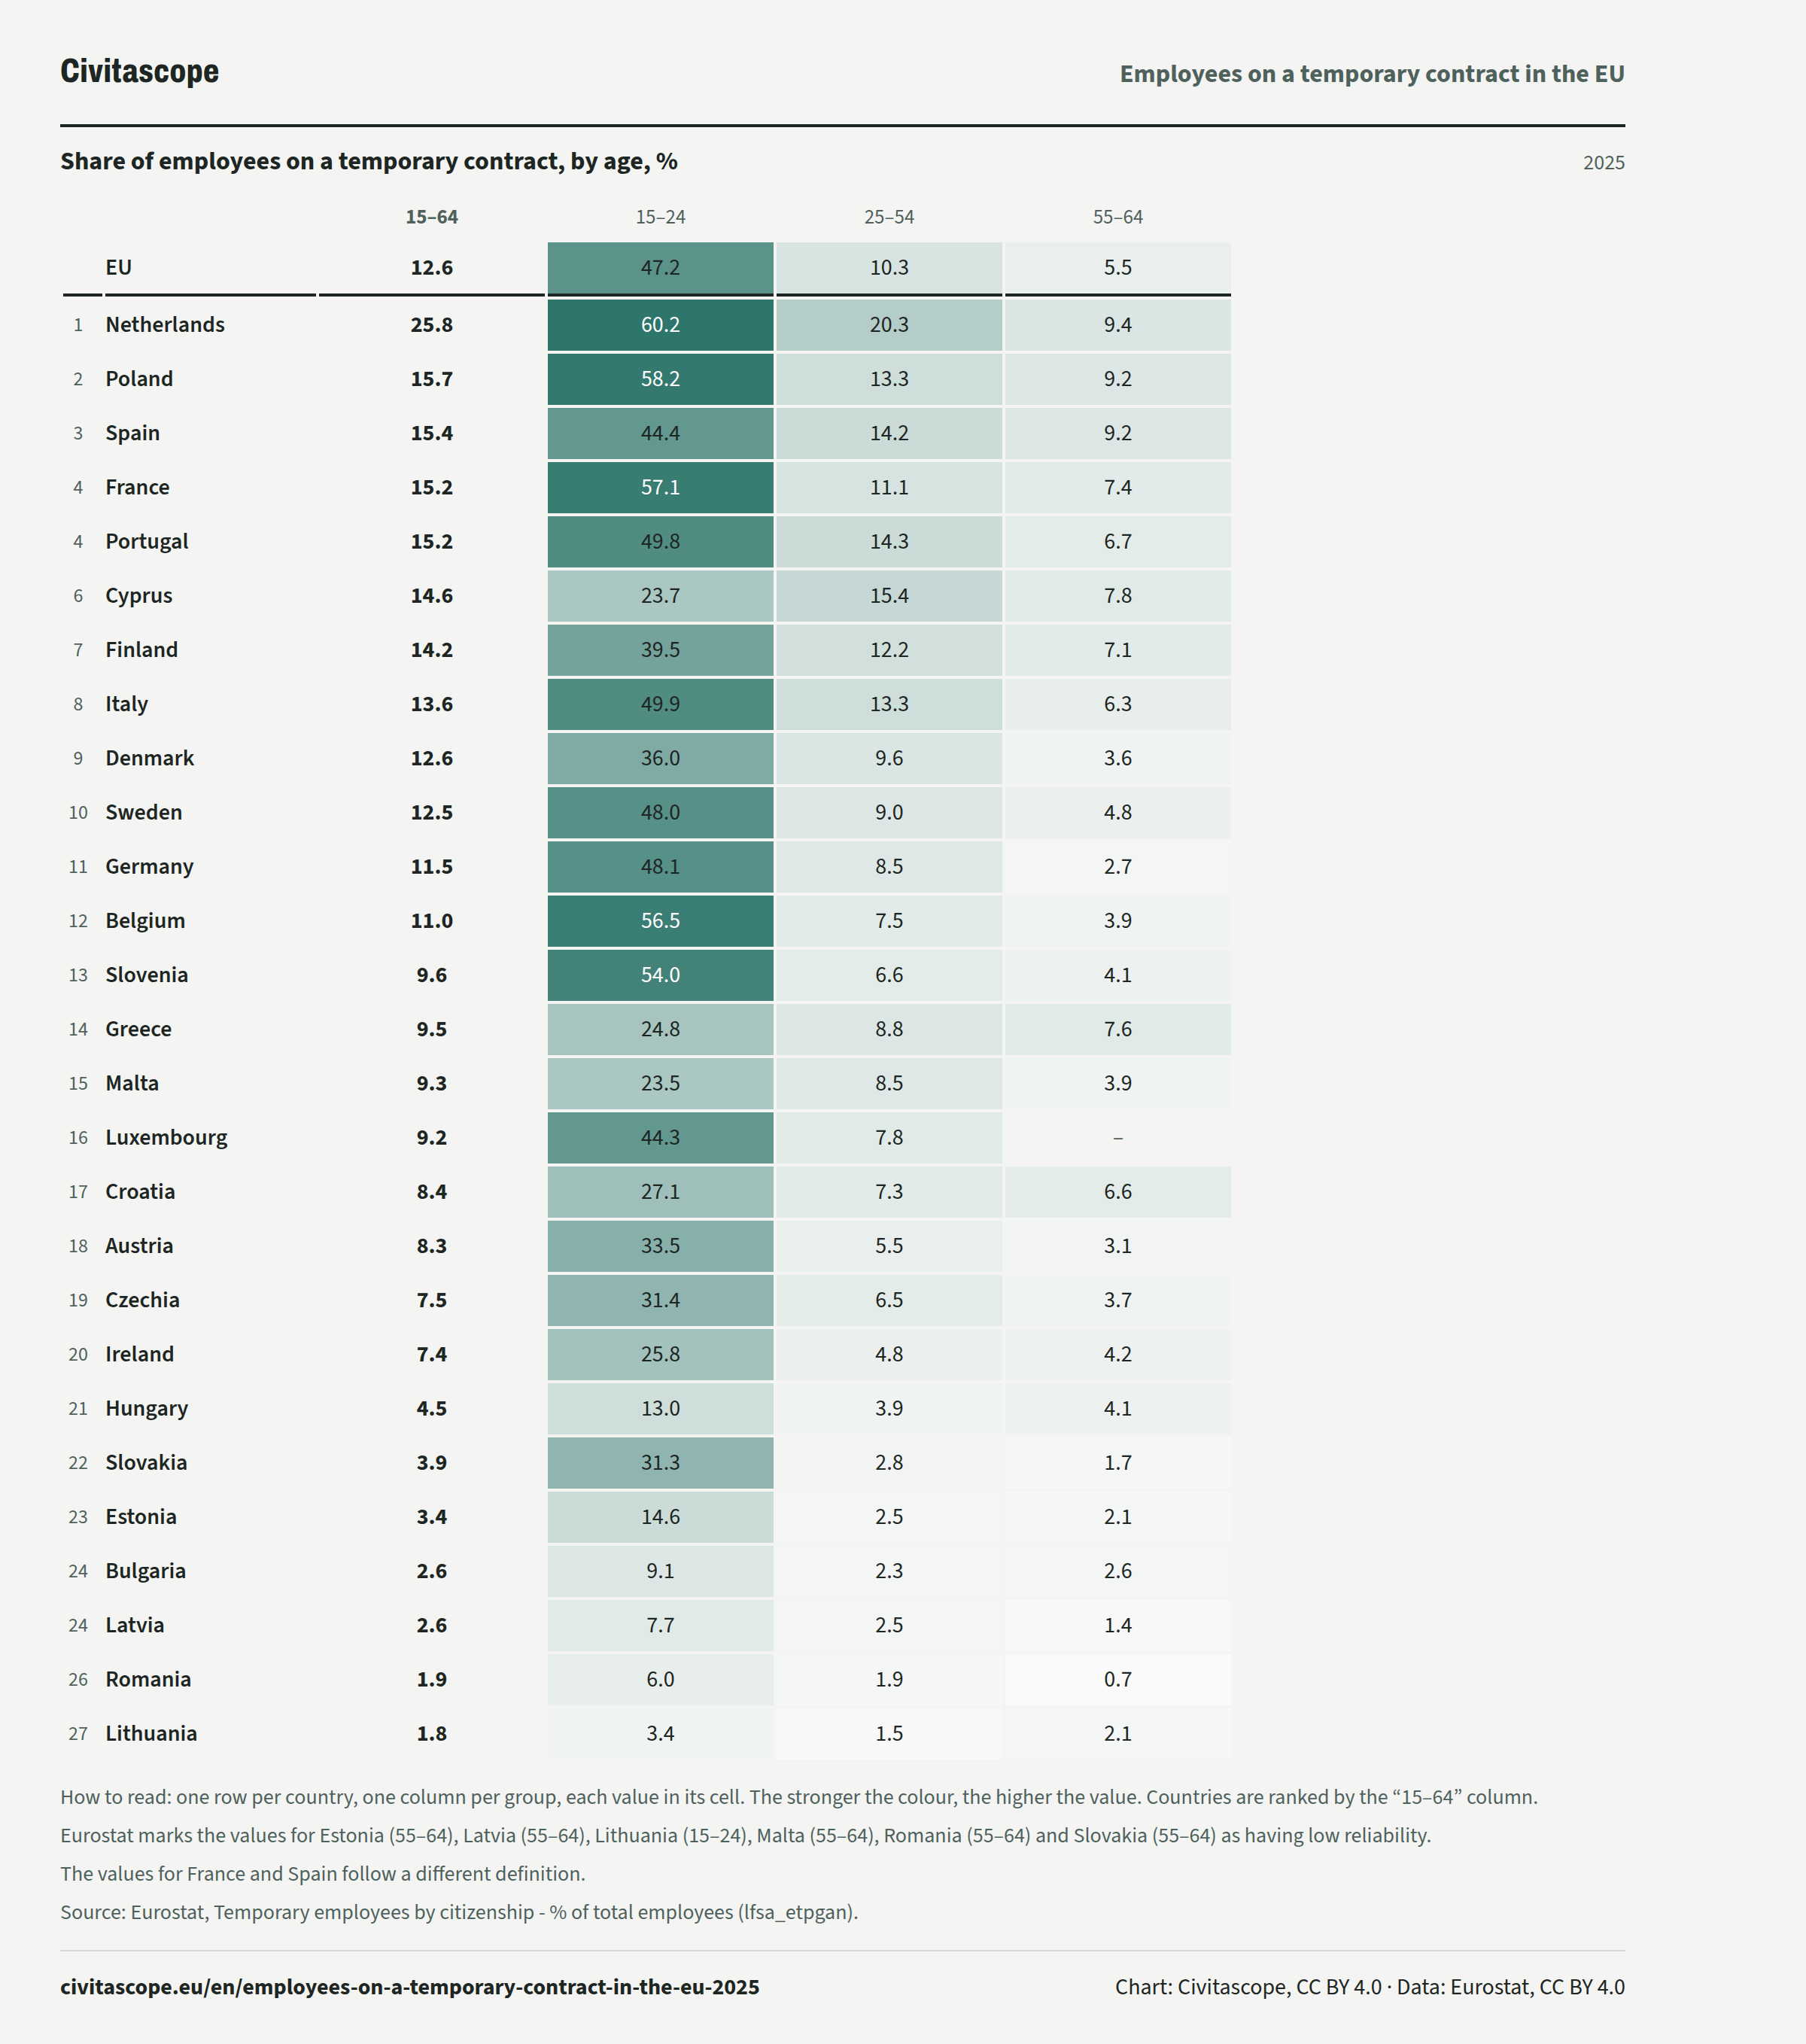
In 2025, 47.2% of employees aged 15 to 24 in the EU had a temporary contract, against 10.3% of those aged 25 to 54 and 5.5% of those aged 55 to 64.
Share of employees on a temporary contract, by age, %
2025| 15–64 | 15–24 | 25–54 | 55–64 | ||
|---|---|---|---|---|---|
| EU, | 15–64: 12.6%, | 15–24: 47.2%, | 25–54: 10.3%, | 55–64: 5.5%, | |
| Rank 1: | Netherlands, | 15–64: 25.8%, | 15–24: 60.2%, | 25–54: 20.3%, | 55–64: 9.4%, |
| Rank 2: | Poland, | 15–64: 15.7%, | 15–24: 58.2%, | 25–54: 13.3%, | 55–64: 9.2%, |
| Rank 3: | Spain, | 15–64: 15.4%, | 15–24: 44.4%, | 25–54: 14.2%, | 55–64: 9.2%, |
| Rank 4: | France, | 15–64: 15.2%, | 15–24: 57.1%, | 25–54: 11.1%, | 55–64: 7.4%, |
| Rank 4: | Portugal, | 15–64: 15.2%, | 15–24: 49.8%, | 25–54: 14.3%, | 55–64: 6.7%, |
| Rank 6: | Cyprus, | 15–64: 14.6%, | 15–24: 23.7%, | 25–54: 15.4%, | 55–64: 7.8%, |
| Rank 7: | Finland, | 15–64: 14.2%, | 15–24: 39.5%, | 25–54: 12.2%, | 55–64: 7.1%, |
| Rank 8: | Italy, | 15–64: 13.6%, | 15–24: 49.9%, | 25–54: 13.3%, | 55–64: 6.3%, |
| Rank 9: | Denmark, | 15–64: 12.6%, | 15–24: 36.0%, | 25–54: 9.6%, | 55–64: 3.6%, |
| Rank 10: | Sweden, | 15–64: 12.5%, | 15–24: 48.0%, | 25–54: 9.0%, | 55–64: 4.8%, |
| Rank 11: | Germany, | 15–64: 11.5%, | 15–24: 48.1%, | 25–54: 8.5%, | 55–64: 2.7%, |
| Rank 12: | Belgium, | 15–64: 11.0%, | 15–24: 56.5%, | 25–54: 7.5%, | 55–64: 3.9%, |
| Rank 13: | Slovenia, | 15–64: 9.6%, | 15–24: 54.0%, | 25–54: 6.6%, | 55–64: 4.1%, |
| Rank 14: | Greece, | 15–64: 9.5%, | 15–24: 24.8%, | 25–54: 8.8%, | 55–64: 7.6%, |
| Rank 15: | Malta, | 15–64: 9.3%, | 15–24: 23.5%, | 25–54: 8.5%, | 55–64: 3.9%, |
| Rank 16: | Luxembourg, | 15–64: 9.2%, | 15–24: 44.3%, | 25–54: 7.8%, | 55–64: – |
| Rank 17: | Croatia, | 15–64: 8.4%, | 15–24: 27.1%, | 25–54: 7.3%, | 55–64: 6.6%, |
| Rank 18: | Austria, | 15–64: 8.3%, | 15–24: 33.5%, | 25–54: 5.5%, | 55–64: 3.1%, |
| Rank 19: | Czechia, | 15–64: 7.5%, | 15–24: 31.4%, | 25–54: 6.5%, | 55–64: 3.7%, |
| Rank 20: | Ireland, | 15–64: 7.4%, | 15–24: 25.8%, | 25–54: 4.8%, | 55–64: 4.2%, |
| Rank 21: | Hungary, | 15–64: 4.5%, | 15–24: 13.0%, | 25–54: 3.9%, | 55–64: 4.1%, |
| Rank 22: | Slovakia, | 15–64: 3.9%, | 15–24: 31.3%, | 25–54: 2.8%, | 55–64: 1.7%, |
| Rank 23: | Estonia, | 15–64: 3.4%, | 15–24: 14.6%, | 25–54: 2.5%, | 55–64: 2.1%, |
| Rank 24: | Bulgaria, | 15–64: 2.6%, | 15–24: 9.1%, | 25–54: 2.3%, | 55–64: 2.6%, |
| Rank 24: | Latvia, | 15–64: 2.6%, | 15–24: 7.7%, | 25–54: 2.5%, | 55–64: 1.4%, |
| Rank 26: | Romania, | 15–64: 1.9%, | 15–24: 6.0%, | 25–54: 1.9%, | 55–64: 0.7%, |
| Rank 27: | Lithuania, | 15–64: 1.8%, | 15–24: 3.4%, | 25–54: 1.5%, | 55–64: 2.1%, |
About the data
The share of employees whose main job has a limited duration, ending on a set date, at the end of a task or when an employee they replace returns, among all employees.
Counted: aged 15 to 64.
Eurostat: “A job may be considered temporary employment (and its holder a temporary employee) if both employer and employee agree that its end is decided by objective rules (usually written down in a work contract of limited life). These rules can be a specific date, the end of a task, or the return of another employee who has been temporarily replaced.” (source)
EU Labour Force Survey (EU-LFS), a sample survey of households run by the national statistical institutes. The answer is the respondent's own account of the contract of the main job.
How to read these numbers
How it is measured
The survey covers people usually living in private households. People in collective or institutional households are not included.
The share is of employees only. The self-employed and contributing family workers are outside both the count and the total. Eurostat also publishes temporary employees as a share of all employed people, which is lower.
Seasonal workers, employees on a separate fixed-term probation contract and trainees on a separate fixed-term training contract count as temporary. Agency workers count as temporary unless they have a contract of unlimited duration with the agency. A verbal agreement counts like a written contract. Only the main job counts.
The groups are by citizenship, not by country of birth. Values for citizens of countries outside the EU are missing or have low reliability in several countries, because few of them are in the sample. Denmark and Malta have no values by citizenship since 2021.
Eurostat marks Luxembourg's value for employees aged 55 to 64 as having low reliability and does not publish it.
France's figures have included the overseas departments Guadeloupe, Martinique, French Guiana and Réunion since 2014, and Mayotte since 2024. Cyprus's figures cover only the areas controlled by the government of the Republic of Cyprus.
Different definitions
Since 2021, every value for Spain and France is marked by Eurostat as following a different definition (flag d). Both countries still use the rules of 2020 and before to decide whether people on temporary lay-off count as employed. This concerns France (2021, 2025) and Spain (2021, 2025).
Breaks in the series
Denmark lengthened its data collection period from two weeks to four in the last quarter of 2023. Its own quality report names a break in the series from 2023 to 2024. Eurostat marks Denmark's break in 2023 in other labour force datasets, with no flag in this one. Values for Denmark up to 2023 and from 2024 are not fully comparable.
A break in the series (flag b) means that a value is not fully comparable with the periods before it. This concerns Bulgaria (2024) and France (2024).
Low reliability
A value of low reliability (flag u) should be read with care. This concerns Croatia (2025), Estonia (2025), Latvia (2025), Lithuania (2025), Malta (2025), Romania (2025) and Slovakia (2025).
Sources and data
Eurostat, Temporary employees by citizenship - % of total employees (lfsa_etpgan). Data updated 30 October 2026, retrieved 13 November 2026. Licence: CC BY 4.0.
Eurostat metadata · Eurostat methodology
https://ec.europa.eu/eurostat/api/dissemination/statistics/1.0/data/lfsa_etpgan?format=JSON&lang=en&age=Y15-64&citizen=TOTAL&freq=A&geo=AT&geo=BE&geo=BG&geo=CY&geo=CZ&geo=DE&geo=DK&geo=EE&geo=EL&geo=ES&geo=EU27_2020&geo=FI&geo=FR&geo=HR&geo=HU&geo=IE&geo=IT&geo=LT&geo=LU&geo=LV&geo=MT&geo=NL&geo=PL&geo=PT&geo=RO&geo=SE&geo=SI&geo=SK&sex=T&unit=PCReport an error: contact [at] civitascope.eu
Related stories
-
The employment rate in the EU countries and regions
In Malta, 83.6% of people aged 20 to 64 are employed, against 67.6% in Italy (2025)
-
Who usually works on Sundays in the EU
In Malta, 21.7% of employed people usually work on Sundays, against 2.7% in Lithuania (2025)
-
Household income per inhabitant in the EU regions
In Luxembourg, the net primary income of households was 36,200 PPS per inhabitant, against 13,200 PPS per inhabitant in Bulgaria (2023)
-
Net annual earnings of an average single worker in the EU
Adjusted for price levels, a single worker on the average wage takes home 2.0 times as much in Luxembourg as in Hungary (2025)