Unmet needs for medical care
Topic: Population and health
In Greece, 11.5% of people aged 16 or over went without medical care they needed because of the cost, the distance or a waiting list, against 0.1% in Cyprus and Malta.
In 2025, 2.4% of people aged 16 or over in the EU said that in the twelve months before the survey they had needed a medical examination or treatment but had not had it, or had not sought it, because it was too expensive, too far to travel or there was a waiting list. The share is of all people aged 16 or over, whether or not they needed medical care. Dental care is counted separately.
- Figures for:
- 2025.
- Covers:
- differs by country.
- New data:
- once a year.
- Dataset updated:
- 20 October 2026.
Published 4 November 2026
The ranking
In 2025, the share of people aged 16 or over who went without a medical examination or treatment they needed because of the cost, the distance or a waiting list ranged from 0.1% in Cyprus and Malta to 11.5% in Greece.
Share of people aged 16 or over who went without a medical examination or treatment they needed because of the cost, the distance or a waiting list, %
2025Women and men
Among men, the spread across countries was narrower. Cyprus and Malta were again the lowest, at 0.1%, and Greece was again the highest, at 9.9%. The highest and the lowest were 9.8 percentage points apart.
Among women, the spread across countries was wider than among men. Greece was again the highest, at 13.1%, and Malta the lowest, at 0.0%. The gap was 13.1 percentage points.
Share of people aged 16 or over who went without a medical examination or treatment they needed because of the cost, the distance or a waiting list: men and women, %
2025| Everyone | Men | Women | |
|---|---|---|---|
| Lowest | 0.1%Cyprus and Malta | 0.1%Cyprus and Malta | 0.0%Malta |
| Highest | 11.5%Greece | 9.9%Greece | 13.1%Greece |
| Highest − lowest | 11.4 pp | 9.8 pp | 13.1 pp |
Cost, waiting list or distance
In 2025, 1.0% of people aged 16 or over in the EU went without medical care they needed mainly because it was too expensive, and 1.2% mainly because of a waiting list.
People aged 16 or over who went without medical care they needed, by main reason, % of all people aged 16 or over
2025Poorest and richest
In 2025, 3.7% of people in the poorest fifth by income in the EU went without medical care they needed, against 1.4% of people in the richest fifth.
Share of people aged 16 or over who went without medical care they needed, by income fifth, %
2025Young and old
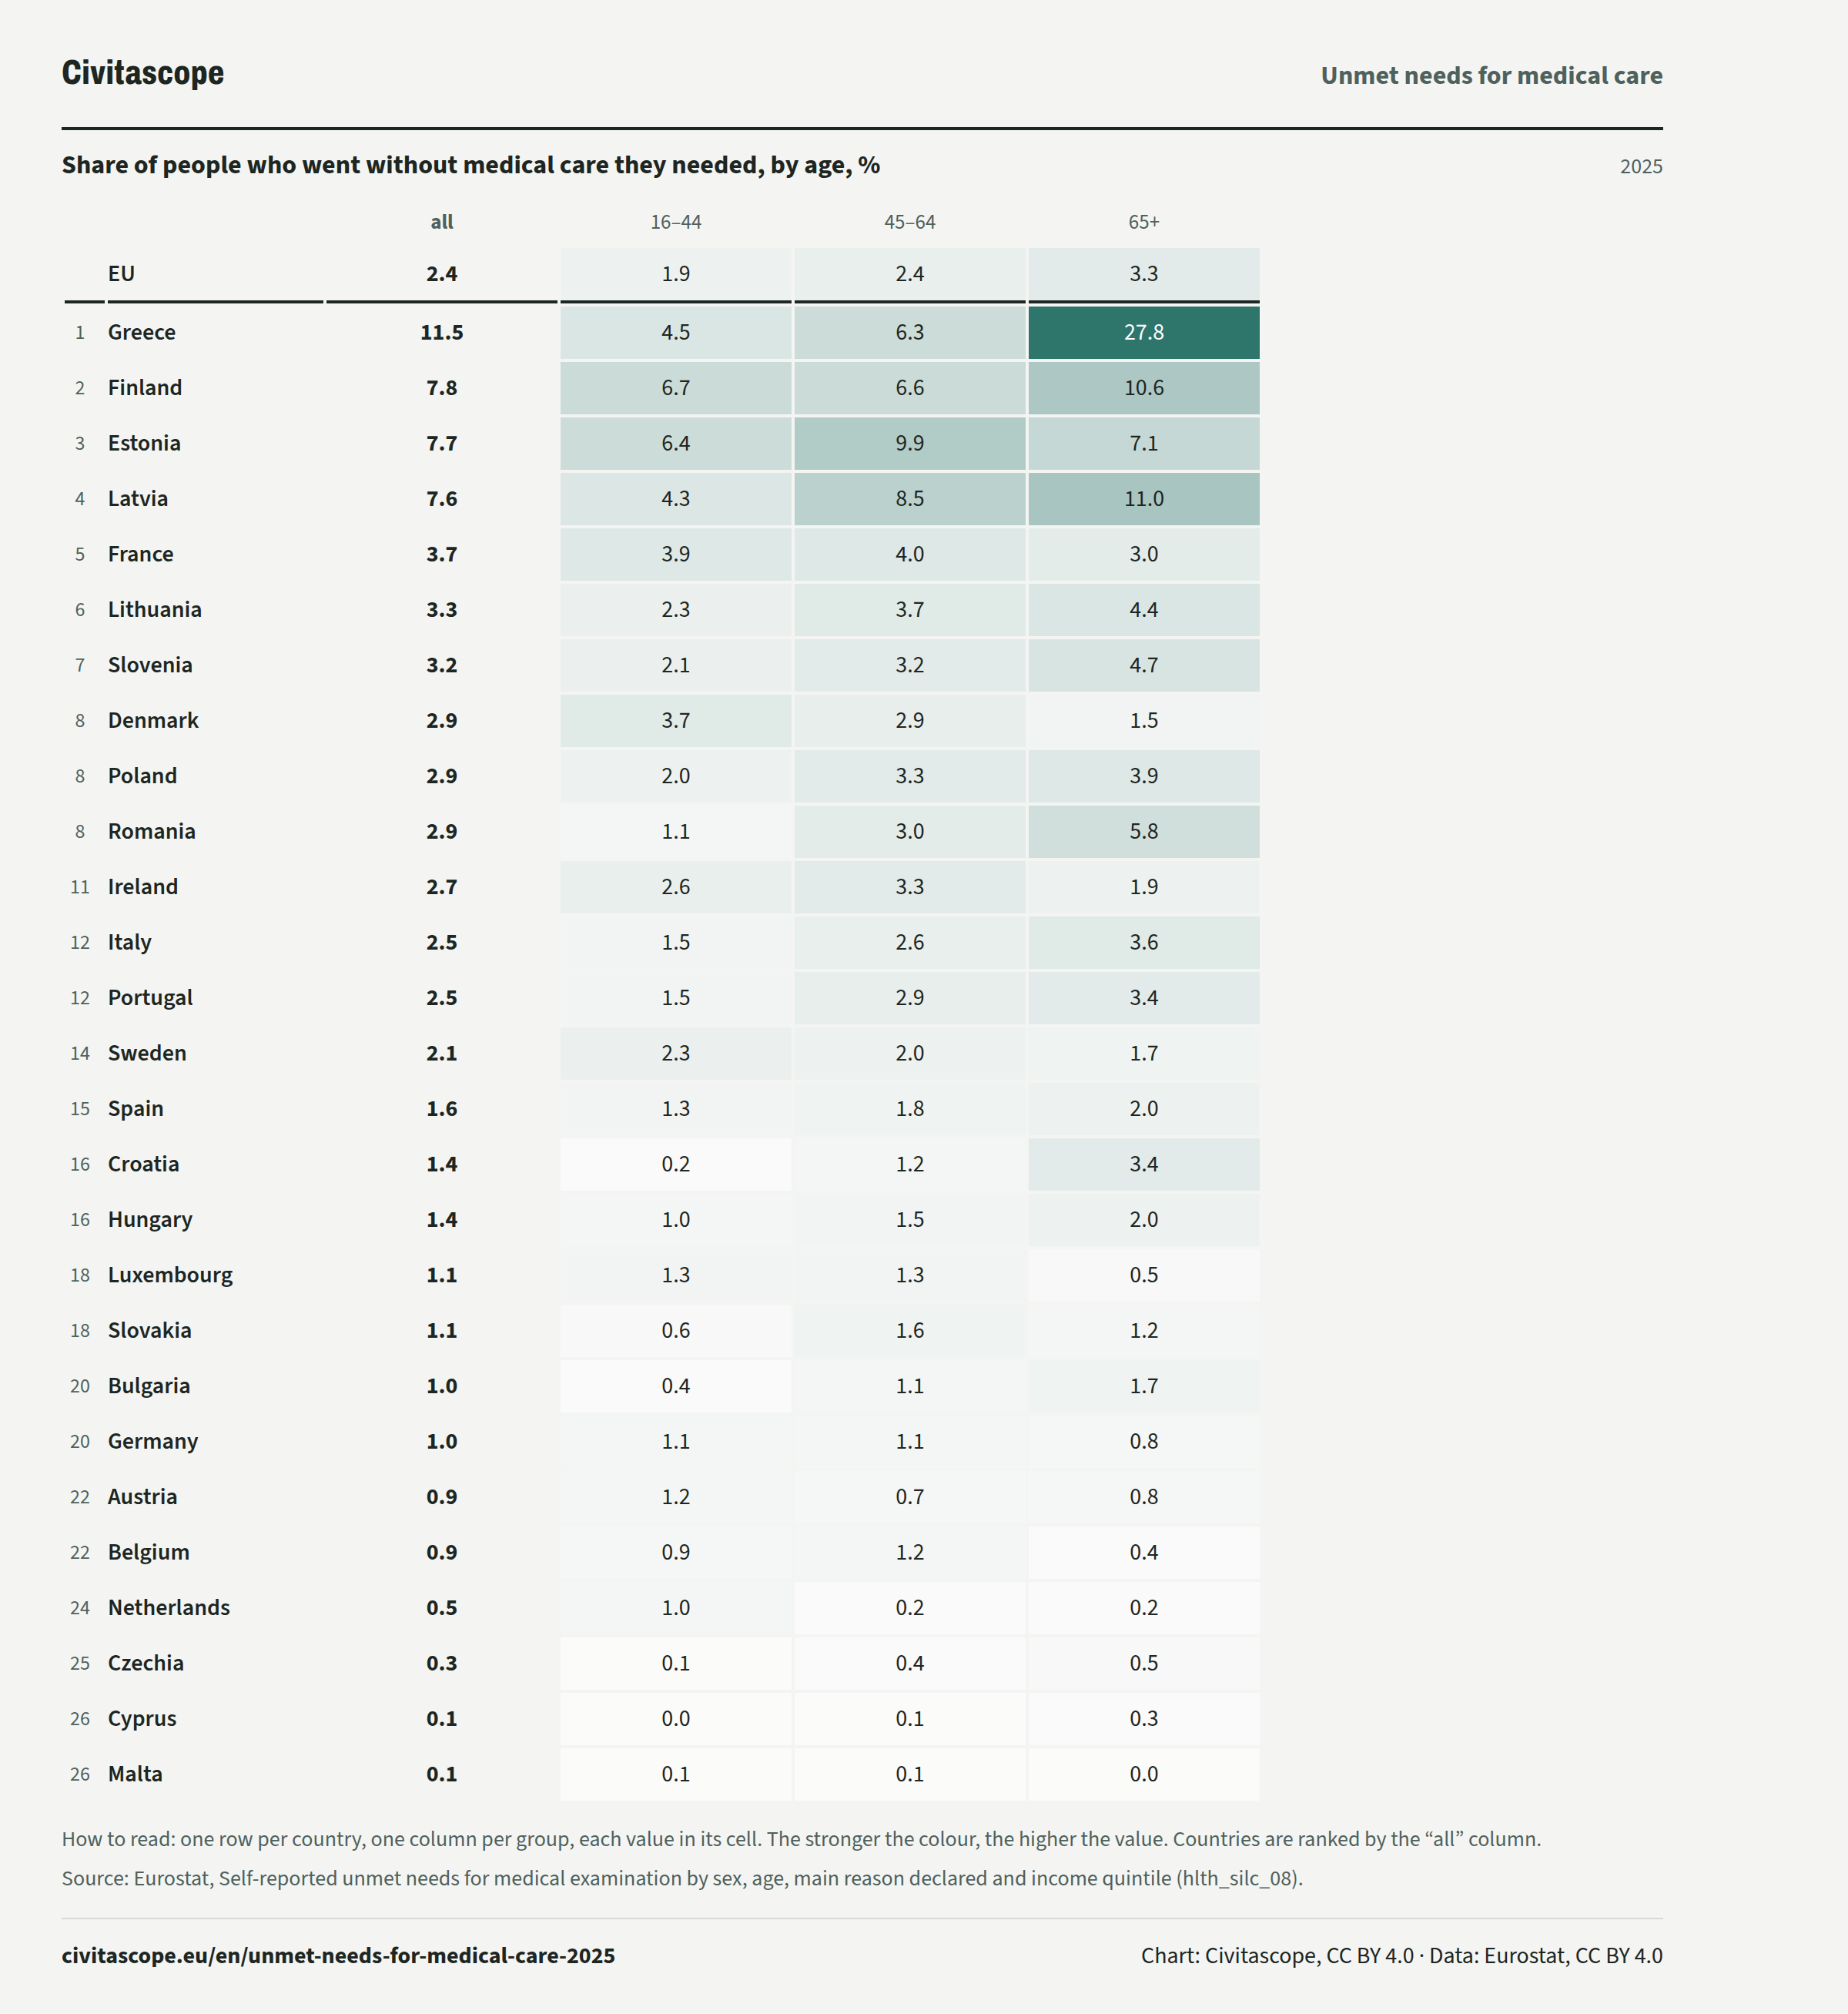
In 2025, 1.9% of people aged 16 to 44 in the EU went without medical care they needed, against 3.3% of people aged 65 or over.
Share of people who went without medical care they needed, by age, %
2025| all | 16–44 | 45–64 | 65+ | ||
|---|---|---|---|---|---|
| EU, | all: 2.4 %, | 16–44: 1.9 %, | 45–64: 2.4 %, | 65+: 3.3 %, | |
| Rank 1: | Greece, | all: 11.5 %, | 16–44: 4.5 %, | 45–64: 6.3 %, | 65+: 27.8 %, |
| Rank 2: | Finland, | all: 7.8 %, | 16–44: 6.7 %, | 45–64: 6.6 %, | 65+: 10.6 %, |
| Rank 3: | Estonia, | all: 7.7 %, | 16–44: 6.4 %, | 45–64: 9.9 %, | 65+: 7.1 %, |
| Rank 4: | Latvia, | all: 7.6 %, | 16–44: 4.3 %, | 45–64: 8.5 %, | 65+: 11.0 %, |
| Rank 5: | France, | all: 3.7 %, | 16–44: 3.9 %, | 45–64: 4.0 %, | 65+: 3.0 %, |
| Rank 6: | Lithuania, | all: 3.3 %, | 16–44: 2.3 %, | 45–64: 3.7 %, | 65+: 4.4 %, |
| Rank 7: | Slovenia, | all: 3.2 %, | 16–44: 2.1 %, | 45–64: 3.2 %, | 65+: 4.7 %, |
| Rank 8: | Denmark, | all: 2.9 %, | 16–44: 3.7 %, | 45–64: 2.9 %, | 65+: 1.5 %, |
| Rank 8: | Poland, | all: 2.9 %, | 16–44: 2.0 %, | 45–64: 3.3 %, | 65+: 3.9 %, |
| Rank 8: | Romania, | all: 2.9 %, | 16–44: 1.1 %, | 45–64: 3.0 %, | 65+: 5.8 %, |
| Rank 11: | Ireland, | all: 2.7 %, | 16–44: 2.6 %, | 45–64: 3.3 %, | 65+: 1.9 %, |
| Rank 12: | Italy, | all: 2.5 %, | 16–44: 1.5 %, | 45–64: 2.6 %, | 65+: 3.6 %, |
| Rank 12: | Portugal, | all: 2.5 %, | 16–44: 1.5 %, | 45–64: 2.9 %, | 65+: 3.4 %, |
| Rank 14: | Sweden, | all: 2.1 %, | 16–44: 2.3 %, | 45–64: 2.0 %, | 65+: 1.7 %, |
| Rank 15: | Spain, | all: 1.6 %, | 16–44: 1.3 %, | 45–64: 1.8 %, | 65+: 2.0 %, |
| Rank 16: | Croatia, | all: 1.4 %, | 16–44: 0.2 %, | 45–64: 1.2 %, | 65+: 3.4 %, |
| Rank 16: | Hungary, | all: 1.4 %, | 16–44: 1.0 %, | 45–64: 1.5 %, | 65+: 2.0 %, |
| Rank 18: | Luxembourg, | all: 1.1 %, | 16–44: 1.3 %, | 45–64: 1.3 %, | 65+: 0.5 %, |
| Rank 18: | Slovakia, | all: 1.1 %, | 16–44: 0.6 %, | 45–64: 1.6 %, | 65+: 1.2 %, |
| Rank 20: | Bulgaria, | all: 1.0 %, | 16–44: 0.4 %, | 45–64: 1.1 %, | 65+: 1.7 %, |
| Rank 20: | Germany, | all: 1.0 %, | 16–44: 1.1 %, | 45–64: 1.1 %, | 65+: 0.8 %, |
| Rank 22: | Austria, | all: 0.9 %, | 16–44: 1.2 %, | 45–64: 0.7 %, | 65+: 0.8 %, |
| Rank 22: | Belgium, | all: 0.9 %, | 16–44: 0.9 %, | 45–64: 1.2 %, | 65+: 0.4 %, |
| Rank 24: | Netherlands, | all: 0.5 %, | 16–44: 1.0 %, | 45–64: 0.2 %, | 65+: 0.2 %, |
| Rank 25: | Czechia, | all: 0.3 %, | 16–44: 0.1 %, | 45–64: 0.4 %, | 65+: 0.5 %, |
| Rank 26: | Cyprus, | all: 0.1 %, | 16–44: 0.0 %, | 45–64: 0.1 %, | 65+: 0.3 %, |
| Rank 26: | Malta, | all: 0.1 %, | 16–44: 0.1 %, | 45–64: 0.1 %, | 65+: 0.0 %, |
About the data
The share of people aged 16 or over who say that in the past 12 months they needed a medical examination or treatment but did not have it, or did not seek it, because it was too expensive, too far to travel or there was a waiting list.
Eurostat: “This indicator measures the share of the population aged 16 and over reporting unmet needs for medical care due to one of the following reasons: ‘financial reasons’, ‘waiting list’ and ‘too far to travel’. Self-reported unmet needs concern a person’s own assessment of whether they needed medical examination or treatment (dental care excluded) but did not have it or did not seek it.” (source)
EU statistics on income and living conditions (EU-SILC), a yearly sample survey of households run by the national statistical institutes. Each person aged 16 or over is asked about their own need for care. Sometimes someone else answers for them.
How to read these numbers
How it is measured
The survey covers people aged 16 or over living in private households. People in collective households and institutions, such as care homes, are generally not included (Estonia includes collective households).
The figure rests on each person's own assessment of whether they needed care and went without it. Social norms and expectations can shape these answers, and Eurostat advises caution when comparing countries. Health care is also organised differently from one country to another. The survey questions vary somewhat between countries and over time.
The share is of all people aged 16 or over, whether or not they needed medical care. A country where few people needed care can have a low share for that reason alone. Dental care is counted separately and is not included.
A person who went without care names one main reason. Someone with several reasons is counted under the main one only. Because of rounding, the three reasons may differ from the total by a tenth.
The figures are not adjusted for age. Each country's figure reflects the age structure of its own population.
Each person was asked about the 12 months before their interview.
The income quintiles split each country's population into five groups of equal size, ranked by equivalised disposable income. The income is that of the calendar year before the survey.
Provisional figures
A provisional value (flag p) may still be revised. This concerns Lithuania (2025).
Sources and data
Eurostat, Self-reported unmet needs for medical examination by sex, age, main reason declared and income quintile (hlth_silc_08). Data updated 20 October 2026, retrieved 4 November 2026. Licence: CC BY 4.0.
Eurostat metadata · Eurostat methodology
https://ec.europa.eu/eurostat/api/dissemination/statistics/1.0/data/hlth_silc_08?format=JSON&lang=en&age=Y_GE16&freq=A&geo=AT&geo=BE&geo=BG&geo=CY&geo=CZ&geo=DE&geo=DK&geo=EE&geo=EL&geo=ES&geo=EU27_2020&geo=FI&geo=FR&geo=HR&geo=HU&geo=IE&geo=IT&geo=LT&geo=LU&geo=LV&geo=MT&geo=NL&geo=PL&geo=PT&geo=RO&geo=SE&geo=SI&geo=SK&quant_inc=TOTAL&reason=TXP_TFAR_WLIST&sex=T&unit=PCRelated stories
-
Healthy life years
A newborn in Italy can expect 73.4 years of life without being limited in usual activities by a health problem, against 52.5 years in Latvia (2024)
-
Excess mortality
11.1% fewer people died in Lithuania than on average in 2016–2019, and 18.0% more in Luxembourg (May 2026)
-
Europe's population in 2100
In Eurostat's baseline projection, the population of Latvia would fall by 33.94%, and that of Luxembourg would grow by 36.43% (2025–2100)
-
How old women are when their first child is born
Women in Italy are 31.9 years old on average when their first child is born, against 26.9 years in Bulgaria (2024)