Who uses internet banking in the EU
Topic: Digital technology
97.61% of people aged 16 to 74 in Denmark used internet banking in three months, against 30.97% in Romania.
In 2025, 69.66% of people aged 16 to 74 in the EU used internet banking for private purposes in the three months before the survey, on a bank's website or in its app. People say this themselves in a survey.
- Figures for:
- 2025.
- Covers:
- differs by country.
- New data:
- once a year.
- Dataset updated:
- 17 April 2026.
Published 9 November 2026
The ranking
In 2025, the share of people aged 16 to 74 who used internet banking was highest in Denmark, at 97.61%, and lowest in Romania, at 30.97%.
Share of people aged 16 to 74 who used internet banking, %
2025 · people aged 16 to 74The regions of the EU
In 2025, 210 of the EU's 213 regions had a value. The share of people aged 16 to 74 who used internet banking was highest in Syddanmark (Denmark), 98.4%, and lowest in Sud-Vest Oltenia (Romania), 17.8%.
Share of people who used internet banking, by region, %
2025 · the EU's 213 regions, NUTS 1 in Germany and Greece and NUTS 2 in the other countries · people aged 16 to 74- 17.8–58.3 (42 regions)
- 58.7–68.2 (42 regions)
- 69.0–76.9 (42 regions)
- 77.0–83.0 (42 regions)
- 83.1–98.4 (42 regions)
- no value
Zoom with two fingers, or with Ctrl and the scroll wheel or the buttons. Zoomed in, drag to move.
Austria79.0
- Wien83.1%
- Vorarlberg81.2%
- Niederösterreich79.1%
- Oberösterreich78.6%
- Tirol77.8%
- Steiermark77.5%
- Salzburg76.1%
- Kärnten75.1%
- Burgenland73.1%
Belgium79.3
- Prov. Vlaams-Brabant87.1%
- Prov. Brabant wallon82.4%
- Prov. Liège81.5%
- Prov. Oost-Vlaanderen81.1%
- Prov. Antwerpen80.7%
- Prov. West-Vlaanderen77.4%
- Prov. Limburg (BE)77.2%
- Prov. Namur77.1%
- Prov. Luxembourg (BE)77.0%
- Prov. Hainaut76.0%
- Région de Bruxelles-Capitale/Brussels Hoofdstedelijk Gewest73.1%
Bulgaria31.1
- Yugozapaden37.8%
- Severoiztochen36.5%
- Severozapaden31.2%
- Severen tsentralen28.6%
- Yuzhen tsentralen25.0%
- Yugoiztochen21.7%
Croatia65.8
- Grad Zagreb74.6%
- Sjeverna Hrvatska67.0%
- Jadranska Hrvatska62.5%
- Panonska Hrvatskano value
Cyprus78.1
- Kýpros78.1%
Czechia84.9
- Praha91.9%
- Moravskoslezsko87.6%
- Jihozápad86.7%
- Střední Čechy86.5%
- Jihovýchod84.1%
- Severovýchod83.8%
- Střední Morava81.9%
- Severozápad75.9%
Denmark97.6
- Syddanmark98.4%
- Hovedstaden98.1%
- Midtjylland97.0%
- Sjælland96.7%
- Nordjylland96.7%
Estonia87.3
- Eesti87.3%
Finland95.5
- Länsi-Suomi96.7%
- Helsinki-Uusimaa96.3%
- Pohjois- ja Itä-Suomi94.4%
- Etelä-Suomi94.0%
- Ålandno value
France78.3
- Haute-Normandie84.0%
- Aquitaine83.8%
- Midi-Pyrénées83.0%
- Pays de la Loire81.0%
- Rhône-Alpes79.4%
- Bretagne79.3%
- Centre — Val de Loire79.3%
- Provence-Alpes-Côte d’Azur78.7%
- Auvergne78.7%
- Ile de France78.7%
- Champagne-Ardenne78.6%
- Poitou-Charentes78.5%
- Franche-Comté78.3%
- Nord-Pas de Calais77.8%
- Bourgogne77.7%
- La Réunion77.3%
- Picardie75.4%
- Lorraine75.2%
- Languedoc-Roussillon75.1%
- Alsace73.5%
- Basse-Normandie71.1%
- Guyane69.6%
- Limousin67.4%
- Martinique62.8%
- Guadeloupe62.6%
- Corse58.3%
- Mayotteno value
Germany70.7
- Hamburg77.4%
- Berlin74.5%
- Baden-Württemberg74.3%
- Rheinland-Pfalz72.4%
- Niedersachsen72.1%
- Bayern71.8%
- Sachsen70.6%
- Nordrhein-Westfalen70.4%
- Hessen69.7%
- Schleswig-Holstein69.5%
- Brandenburg67.3%
- Bremen64.7%
- Thüringen61.0%
- Mecklenburg-Vorpommern60.7%
- Sachsen-Anhalt59.1%
- Saarland58.7%
Greece63.0
- Attiki72.1%
- Voreia Elláda68.2%
- Kentriki Elláda49.6%
- Nisia Aigaiou, Kriti48.1%
Hungary69.2
- Budapest82.3%
- Pest75.2%
- Közép-Dunántúl70.0%
- Nyugat-Dunántúl67.9%
- Dél-Alföld64.4%
- Észak-Magyarország62.6%
- Dél-Dunántúl62.1%
- Észak-Alföld60.7%
Ireland95.2
- Eastern and Midland96.0%
- Northern and Western94.7%
- Southern94.3%
Italy56.4
- Provincia Autonoma di Trento70.9%
- Lombardia66.7%
- Emilia-Romagna66.5%
- Valle d’Aosta/Vallée d’Aoste65.2%
- Friuli-Venezia Giulia64.6%
- Liguria63.6%
- Provincia Autonoma di Bolzano/Bozen63.2%
- Marche62.7%
- Piemonte62.1%
- Veneto61.0%
- Toscana60.8%
- Lazio59.0%
- Sardegna56.5%
- Umbria56.3%
- Abruzzo50.5%
- Puglia45.5%
- Molise44.3%
- Sicilia44.3%
- Basilicata40.6%
- Campania37.0%
- Calabria35.4%
Latvia86.0
- Latvija86.0%
Lithuania79.3
- Sostinės regionas87.5%
- Vidurio ir vakarų Lietuvos regionas75.7%
Luxembourg74.4
- Luxembourg74.4%
Malta77.6
- Malta77.6%
Netherlands95.6
- Zeeland98.1%
- Noord-Holland97.0%
- Zuid-Holland96.5%
- Groningen95.8%
- Noord-Brabant95.7%
- Gelderland95.6%
- Utrecht95.2%
- Drenthe95.0%
- Friesland (NL)93.9%
- Overijssel93.8%
- Limburg (NL)92.4%
- Flevoland91.1%
Poland58.2
- Warszawski stołeczny77.7%
- Dolnośląskie67.1%
- Podkarpackie63.5%
- Śląskie63.1%
- Mazowiecki regionalny61.8%
- Zachodniopomorskie57.4%
- Opolskie56.7%
- Pomorskie56.6%
- Kujawsko-pomorskie55.8%
- Łódzkie55.3%
- Wielkopolskie54.8%
- Świętokrzyskie54.8%
- Lubelskie51.6%
- Lubuskie50.6%
- Podlaskie49.9%
- Małopolskie49.2%
- Warmińsko-mazurskie44.8%
Portugal65.2
- Grande Lisboa75.5%
- Península de Setúbal71.5%
- Centro (PT)65.9%
- Região Autónoma da Madeira64.3%
- Oeste e Vale do Tejo63.8%
- Algarve62.7%
- Região Autónoma dos Açores60.7%
- Norte59.7%
- Alentejo57.7%
Romania31.0
- Bucureşti-Ilfov49.8%
- Nord-Vest33.3%
- Vest32.0%
- Centru30.9%
- Sud-Muntenia30.3%
- Nord-Est26.6%
- Sud-Est26.2%
- Sud-Vest Oltenia17.8%
Slovakia60.5
- Bratislavský kraj80.1%
- Východné Slovensko57.7%
- Stredné Slovensko57.6%
- Západné Slovensko57.2%
Slovenia65.6
- Zahodna Slovenija67.7%
- Vzhodna Slovenija63.7%
Spain74.8
- Illes Balears84.4%
- Cataluña80.0%
- Comunidad de Madrid79.1%
- País Vasco77.1%
- Cantabria77.1%
- Galicia76.9%
- Ciudad de Melilla75.4%
- Comunitat Valenciana74.9%
- Comunidad Foral de Navarra74.6%
- Canarias73.8%
- Aragón71.7%
- Principado de Asturias71.6%
- La Rioja71.4%
- Castilla y León71.1%
- Ciudad de Ceuta70.5%
- Región de Murcia70.1%
- Andalucía69.0%
- Castilla-La Mancha68.1%
- Extremadura67.3%
Sweden82.0
- Mellersta Norrland86.1%
- Västsverige83.5%
- Övre Norrland83.3%
- Sydsverige83.1%
- Stockholm82.2%
- Norra Mellansverige81.0%
- Småland med öarna80.2%
- Östra Mellansverige79.2%
Over time
Share of people aged 16 to 74 who used internet banking in the EU, %
2019–2025 · people aged 16 to 74Between 2019 and 2025, the share fell in 1 country and rose in 26.
Share of people aged 16 to 74 who used internet banking, %
2019 and 2025 · ranked by 2025 · people aged 16 to 74Young and old
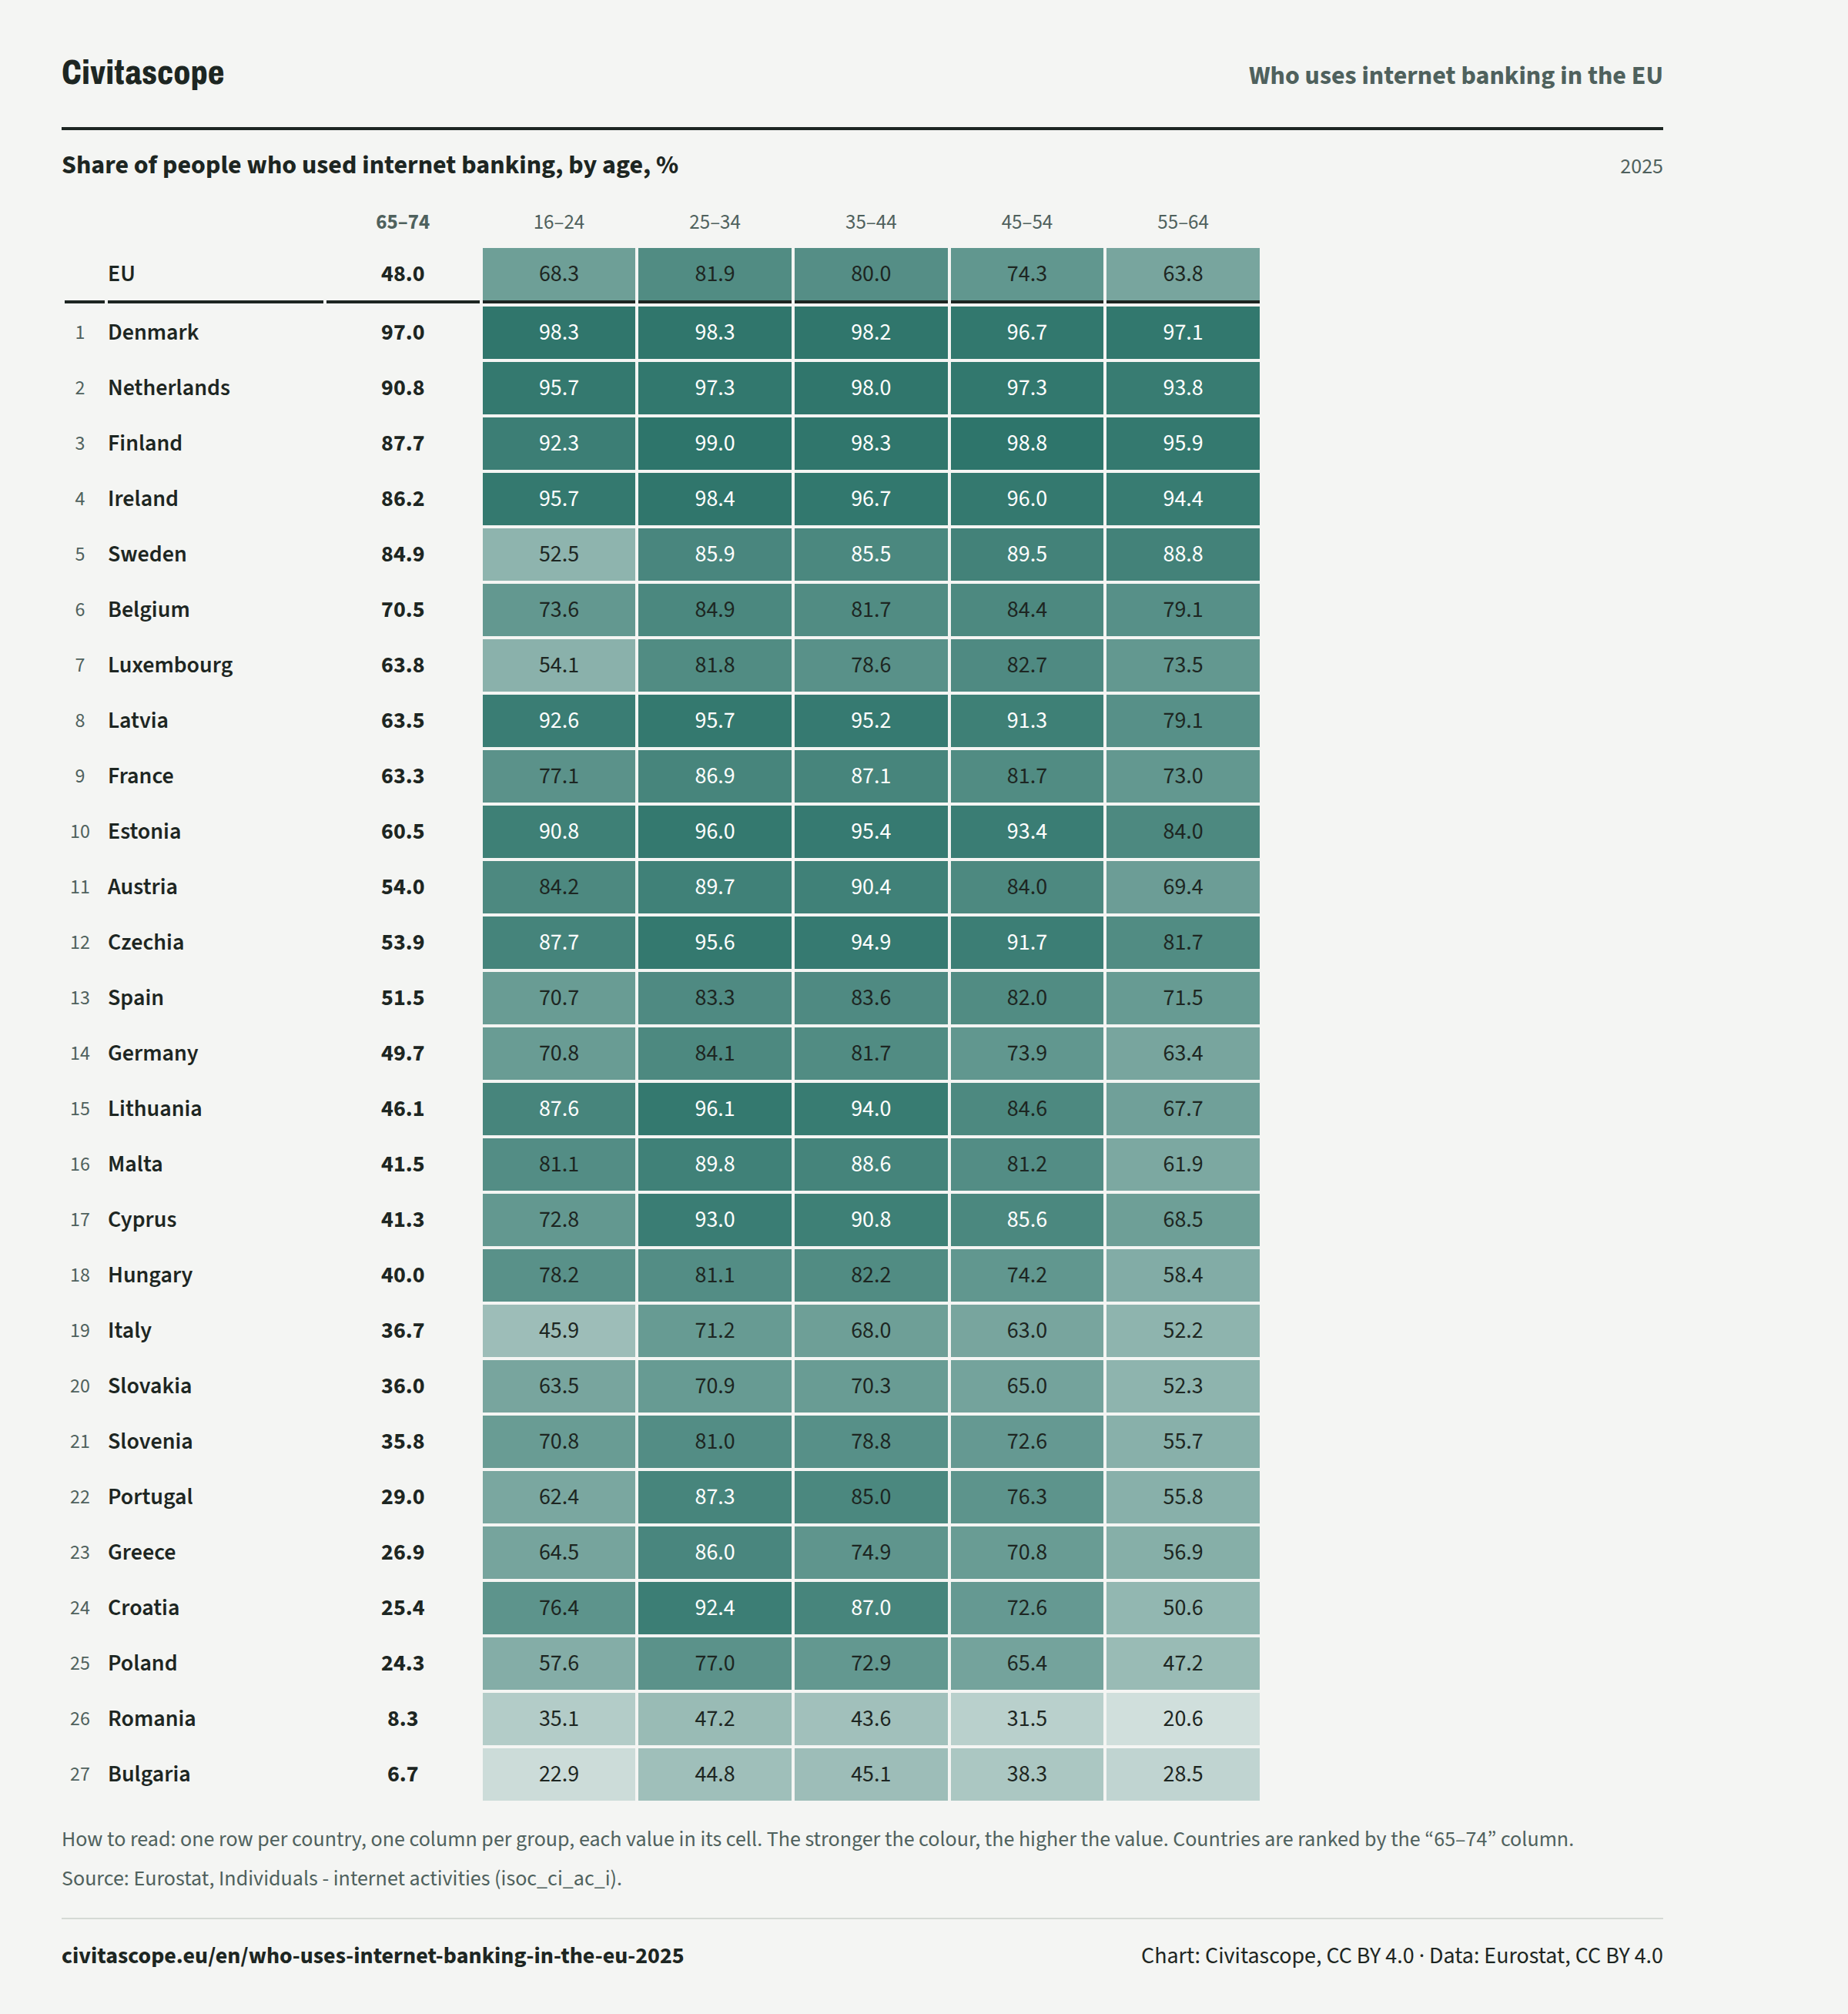
In 2025, 81.9% of people aged 25 to 34 in the EU used internet banking, against 48.0% of people aged 65 to 74.
Share of people who used internet banking, by age, %
2025| 65–74 | 16–24 | 25–34 | 35–44 | 45–54 | 55–64 | ||
|---|---|---|---|---|---|---|---|
| EU, | 65–74: 48.0%, | 16–24: 68.3%, | 25–34: 81.9%, | 35–44: 80.0%, | 45–54: 74.3%, | 55–64: 63.8%, | |
| Rank 1: | Denmark, | 65–74: 97.0%, | 16–24: 98.3%, | 25–34: 98.3%, | 35–44: 98.2%, | 45–54: 96.7%, | 55–64: 97.1%, |
| Rank 2: | Netherlands, | 65–74: 90.8%, | 16–24: 95.7%, | 25–34: 97.3%, | 35–44: 98.0%, | 45–54: 97.3%, | 55–64: 93.8%, |
| Rank 3: | Finland, | 65–74: 87.7%, | 16–24: 92.3%, | 25–34: 99.0%, | 35–44: 98.3%, | 45–54: 98.8%, | 55–64: 95.9%, |
| Rank 4: | Ireland, | 65–74: 86.2%, | 16–24: 95.7%, | 25–34: 98.4%, | 35–44: 96.7%, | 45–54: 96.0%, | 55–64: 94.4%, |
| Rank 5: | Sweden, | 65–74: 84.9%, | 16–24: 52.5%, | 25–34: 85.9%, | 35–44: 85.5%, | 45–54: 89.5%, | 55–64: 88.8%, |
| Rank 6: | Belgium, | 65–74: 70.5%, | 16–24: 73.6%, | 25–34: 84.9%, | 35–44: 81.7%, | 45–54: 84.4%, | 55–64: 79.1%, |
| Rank 7: | Luxembourg, | 65–74: 63.8%, | 16–24: 54.1%, | 25–34: 81.8%, | 35–44: 78.6%, | 45–54: 82.7%, | 55–64: 73.5%, |
| Rank 8: | Latvia, | 65–74: 63.5%, | 16–24: 92.6%, | 25–34: 95.7%, | 35–44: 95.2%, | 45–54: 91.3%, | 55–64: 79.1%, |
| Rank 9: | France, | 65–74: 63.3%, | 16–24: 77.1%, | 25–34: 86.9%, | 35–44: 87.1%, | 45–54: 81.7%, | 55–64: 73.0%, |
| Rank 10: | Estonia, | 65–74: 60.5%, | 16–24: 90.8%, | 25–34: 96.0%, | 35–44: 95.4%, | 45–54: 93.4%, | 55–64: 84.0%, |
| Rank 11: | Austria, | 65–74: 54.0%, | 16–24: 84.2%, | 25–34: 89.7%, | 35–44: 90.4%, | 45–54: 84.0%, | 55–64: 69.4%, |
| Rank 12: | Czechia, | 65–74: 53.9%, | 16–24: 87.7%, | 25–34: 95.6%, | 35–44: 94.9%, | 45–54: 91.7%, | 55–64: 81.7%, |
| Rank 13: | Spain, | 65–74: 51.5%, | 16–24: 70.7%, | 25–34: 83.3%, | 35–44: 83.6%, | 45–54: 82.0%, | 55–64: 71.5%, |
| Rank 14: | Germany, | 65–74: 49.7%, | 16–24: 70.8%, | 25–34: 84.1%, | 35–44: 81.7%, | 45–54: 73.9%, | 55–64: 63.4%, |
| Rank 15: | Lithuania, | 65–74: 46.1%, | 16–24: 87.6%, | 25–34: 96.1%, | 35–44: 94.0%, | 45–54: 84.6%, | 55–64: 67.7%, |
| Rank 16: | Malta, | 65–74: 41.5%, | 16–24: 81.1%, | 25–34: 89.8%, | 35–44: 88.6%, | 45–54: 81.2%, | 55–64: 61.9%, |
| Rank 17: | Cyprus, | 65–74: 41.3%, | 16–24: 72.8%, | 25–34: 93.0%, | 35–44: 90.8%, | 45–54: 85.6%, | 55–64: 68.5%, |
| Rank 18: | Hungary, | 65–74: 40.0%, | 16–24: 78.2%, | 25–34: 81.1%, | 35–44: 82.2%, | 45–54: 74.2%, | 55–64: 58.4%, |
| Rank 19: | Italy, | 65–74: 36.7%, | 16–24: 45.9%, | 25–34: 71.2%, | 35–44: 68.0%, | 45–54: 63.0%, | 55–64: 52.2%, |
| Rank 20: | Slovakia, | 65–74: 36.0%, | 16–24: 63.5%, | 25–34: 70.9%, | 35–44: 70.3%, | 45–54: 65.0%, | 55–64: 52.3%, |
| Rank 21: | Slovenia, | 65–74: 35.8%, | 16–24: 70.8%, | 25–34: 81.0%, | 35–44: 78.8%, | 45–54: 72.6%, | 55–64: 55.7%, |
| Rank 22: | Portugal, | 65–74: 29.0%, | 16–24: 62.4%, | 25–34: 87.3%, | 35–44: 85.0%, | 45–54: 76.3%, | 55–64: 55.8%, |
| Rank 23: | Greece, | 65–74: 26.9%, | 16–24: 64.5%, | 25–34: 86.0%, | 35–44: 74.9%, | 45–54: 70.8%, | 55–64: 56.9%, |
| Rank 24: | Croatia, | 65–74: 25.4%, | 16–24: 76.4%, | 25–34: 92.4%, | 35–44: 87.0%, | 45–54: 72.6%, | 55–64: 50.6%, |
| Rank 25: | Poland, | 65–74: 24.3%, | 16–24: 57.6%, | 25–34: 77.0%, | 35–44: 72.9%, | 45–54: 65.4%, | 55–64: 47.2%, |
| Rank 26: | Romania, | 65–74: 8.3%, | 16–24: 35.1%, | 25–34: 47.2%, | 35–44: 43.6%, | 45–54: 31.5%, | 55–64: 20.6%, |
| Rank 27: | Bulgaria, | 65–74: 6.7%, | 16–24: 22.9%, | 25–34: 44.8%, | 35–44: 45.1%, | 45–54: 38.3%, | 55–64: 28.5%, |
| 65–74 | 16–24 | 25–34 | 35–44 | ||
|---|---|---|---|---|---|
| EU, | 65–74: 48.0%, | 16–24: 68.3%, | 25–34: 81.9%, | 35–44: 80.0%, | |
| Rank 1: | Denmark, | 65–74: 97.0%, | 16–24: 98.3%, | 25–34: 98.3%, | 35–44: 98.2%, |
| Rank 2: | Netherlands, | 65–74: 90.8%, | 16–24: 95.7%, | 25–34: 97.3%, | 35–44: 98.0%, |
| Rank 3: | Finland, | 65–74: 87.7%, | 16–24: 92.3%, | 25–34: 99.0%, | 35–44: 98.3%, |
| Rank 4: | Ireland, | 65–74: 86.2%, | 16–24: 95.7%, | 25–34: 98.4%, | 35–44: 96.7%, |
| Rank 5: | Sweden, | 65–74: 84.9%, | 16–24: 52.5%, | 25–34: 85.9%, | 35–44: 85.5%, |
| Rank 6: | Belgium, | 65–74: 70.5%, | 16–24: 73.6%, | 25–34: 84.9%, | 35–44: 81.7%, |
| Rank 7: | Luxembourg, | 65–74: 63.8%, | 16–24: 54.1%, | 25–34: 81.8%, | 35–44: 78.6%, |
| Rank 8: | Latvia, | 65–74: 63.5%, | 16–24: 92.6%, | 25–34: 95.7%, | 35–44: 95.2%, |
| Rank 9: | France, | 65–74: 63.3%, | 16–24: 77.1%, | 25–34: 86.9%, | 35–44: 87.1%, |
| Rank 10: | Estonia, | 65–74: 60.5%, | 16–24: 90.8%, | 25–34: 96.0%, | 35–44: 95.4%, |
| Rank 11: | Austria, | 65–74: 54.0%, | 16–24: 84.2%, | 25–34: 89.7%, | 35–44: 90.4%, |
| Rank 12: | Czechia, | 65–74: 53.9%, | 16–24: 87.7%, | 25–34: 95.6%, | 35–44: 94.9%, |
| Rank 13: | Spain, | 65–74: 51.5%, | 16–24: 70.7%, | 25–34: 83.3%, | 35–44: 83.6%, |
| Rank 14: | Germany, | 65–74: 49.7%, | 16–24: 70.8%, | 25–34: 84.1%, | 35–44: 81.7%, |
| Rank 15: | Lithuania, | 65–74: 46.1%, | 16–24: 87.6%, | 25–34: 96.1%, | 35–44: 94.0%, |
| Rank 16: | Malta, | 65–74: 41.5%, | 16–24: 81.1%, | 25–34: 89.8%, | 35–44: 88.6%, |
| Rank 17: | Cyprus, | 65–74: 41.3%, | 16–24: 72.8%, | 25–34: 93.0%, | 35–44: 90.8%, |
| Rank 18: | Hungary, | 65–74: 40.0%, | 16–24: 78.2%, | 25–34: 81.1%, | 35–44: 82.2%, |
| Rank 19: | Italy, | 65–74: 36.7%, | 16–24: 45.9%, | 25–34: 71.2%, | 35–44: 68.0%, |
| Rank 20: | Slovakia, | 65–74: 36.0%, | 16–24: 63.5%, | 25–34: 70.9%, | 35–44: 70.3%, |
| Rank 21: | Slovenia, | 65–74: 35.8%, | 16–24: 70.8%, | 25–34: 81.0%, | 35–44: 78.8%, |
| Rank 22: | Portugal, | 65–74: 29.0%, | 16–24: 62.4%, | 25–34: 87.3%, | 35–44: 85.0%, |
| Rank 23: | Greece, | 65–74: 26.9%, | 16–24: 64.5%, | 25–34: 86.0%, | 35–44: 74.9%, |
| Rank 24: | Croatia, | 65–74: 25.4%, | 16–24: 76.4%, | 25–34: 92.4%, | 35–44: 87.0%, |
| Rank 25: | Poland, | 65–74: 24.3%, | 16–24: 57.6%, | 25–34: 77.0%, | 35–44: 72.9%, |
| Rank 26: | Romania, | 65–74: 8.3%, | 16–24: 35.1%, | 25–34: 47.2%, | 35–44: 43.6%, |
| Rank 27: | Bulgaria, | 65–74: 6.7%, | 16–24: 22.9%, | 25–34: 44.8%, | 35–44: 45.1%, |
| 65–74 | 45–54 | 55–64 | ||
|---|---|---|---|---|
| EU, | 65–74: 48.0%, | 45–54: 74.3%, | 55–64: 63.8%, | |
| Rank 1: | Denmark, | 65–74: 97.0%, | 45–54: 96.7%, | 55–64: 97.1%, |
| Rank 2: | Netherlands, | 65–74: 90.8%, | 45–54: 97.3%, | 55–64: 93.8%, |
| Rank 3: | Finland, | 65–74: 87.7%, | 45–54: 98.8%, | 55–64: 95.9%, |
| Rank 4: | Ireland, | 65–74: 86.2%, | 45–54: 96.0%, | 55–64: 94.4%, |
| Rank 5: | Sweden, | 65–74: 84.9%, | 45–54: 89.5%, | 55–64: 88.8%, |
| Rank 6: | Belgium, | 65–74: 70.5%, | 45–54: 84.4%, | 55–64: 79.1%, |
| Rank 7: | Luxembourg, | 65–74: 63.8%, | 45–54: 82.7%, | 55–64: 73.5%, |
| Rank 8: | Latvia, | 65–74: 63.5%, | 45–54: 91.3%, | 55–64: 79.1%, |
| Rank 9: | France, | 65–74: 63.3%, | 45–54: 81.7%, | 55–64: 73.0%, |
| Rank 10: | Estonia, | 65–74: 60.5%, | 45–54: 93.4%, | 55–64: 84.0%, |
| Rank 11: | Austria, | 65–74: 54.0%, | 45–54: 84.0%, | 55–64: 69.4%, |
| Rank 12: | Czechia, | 65–74: 53.9%, | 45–54: 91.7%, | 55–64: 81.7%, |
| Rank 13: | Spain, | 65–74: 51.5%, | 45–54: 82.0%, | 55–64: 71.5%, |
| Rank 14: | Germany, | 65–74: 49.7%, | 45–54: 73.9%, | 55–64: 63.4%, |
| Rank 15: | Lithuania, | 65–74: 46.1%, | 45–54: 84.6%, | 55–64: 67.7%, |
| Rank 16: | Malta, | 65–74: 41.5%, | 45–54: 81.2%, | 55–64: 61.9%, |
| Rank 17: | Cyprus, | 65–74: 41.3%, | 45–54: 85.6%, | 55–64: 68.5%, |
| Rank 18: | Hungary, | 65–74: 40.0%, | 45–54: 74.2%, | 55–64: 58.4%, |
| Rank 19: | Italy, | 65–74: 36.7%, | 45–54: 63.0%, | 55–64: 52.2%, |
| Rank 20: | Slovakia, | 65–74: 36.0%, | 45–54: 65.0%, | 55–64: 52.3%, |
| Rank 21: | Slovenia, | 65–74: 35.8%, | 45–54: 72.6%, | 55–64: 55.7%, |
| Rank 22: | Portugal, | 65–74: 29.0%, | 45–54: 76.3%, | 55–64: 55.8%, |
| Rank 23: | Greece, | 65–74: 26.9%, | 45–54: 70.8%, | 55–64: 56.9%, |
| Rank 24: | Croatia, | 65–74: 25.4%, | 45–54: 72.6%, | 55–64: 50.6%, |
| Rank 25: | Poland, | 65–74: 24.3%, | 45–54: 65.4%, | 55–64: 47.2%, |
| Rank 26: | Romania, | 65–74: 8.3%, | 45–54: 31.5%, | 55–64: 20.6%, |
| Rank 27: | Bulgaria, | 65–74: 6.7%, | 45–54: 38.3%, | 55–64: 28.5%, |
Education
In 2025, 87.23% of people with high formal education in the EU used internet banking, against 46.55% of people with low or no formal education.
Share of people who used internet banking, by level of formal education, %
2025Cities, towns and rural areas
In 2025, 73.9% of people living in cities in the EU used internet banking, against 63.7% of people living in rural areas.
Share of people who used internet banking, by degree of urbanisation, %
2025About the data
The share of people aged 16 to 74 who used internet banking, on a bank's website or in its app, for private purposes in the three months before the survey.
Counted: people aged 16 to 74.
Left out:
- people living in institutions such as hospitals or prisons
Eurostat: “The item refers to the usage of internet banking services including electronic transactions with a bank for payment, transfers, etc. or for looking up account information.” (source)
The data come from a sample survey, the EU survey on the use of ICT in households and by individuals. The national statistical institutes run it every year. The figures are what people reported about themselves.
How to read these numbers
How it is measured
Internet banking counts when a person used a bank's website or app for private purposes, to make payments or transfers or to look up account information. Mobile banking and banks that work only through an app count. Electronic wallets do not count. Transactions for other financial services do not count either.
Each person was asked about the 3 months before their interview, and the countries held their interviews at different times. In 2025 they ran from 13 January to 8 April in Italy, for example, and from 15 July to 10 September in Greece.
France's figures cover the whole country except Mayotte. Cyprus's figures cover only the areas controlled by the government of the Republic of Cyprus. Portugal's include the Azores and Madeira. The Netherlands' leave out the Caribbean islands of the Kingdom of the Netherlands.
The regions are NUTS 2 regions in most countries. For Germany and Greece the data are for NUTS 1 regions only, the larger level. Countries must report NUTS 1 regions and may report NUTS 2 regions. One of Croatia's four NUTS 2 regions, Panonska Hrvatska, is not in the dataset.
A region's value rests on the people sampled in it, fewer than for the whole country. In some regions the sample may be small.
The regional dataset has no EU figure.
Revisions
In 2025 Hungary's statistical office (KSH) adapted its questionnaire to modernised data collection and took the population totals for weighting from the 2022 census. It marks no break in the series. Some 2025 values differ from 2024 more than expected, and the KSH has checked them and considers them valid.
Breaks in the series
Ireland announced a new way of selecting and contacting respondents for its 2024 survey. Eurostat marks no break.
Slovakia's figure fell sharply in 2022 and was back at its earlier level in 2023. Eurostat marks no break and gives no reason.
A break in the series (flag b) means that a value is not fully comparable with the years before it. This concerns Germany (2021), Ireland (2021) and the EU (2021).
Estimates
A value with flag e is an estimate, not measured or counted in full. This concerns the EU (2020).
Low reliability
A value of low reliability (flag u) should be read with care. This concerns Malta's 2025 value for people living in rural areas and the 2025 values of the regions of France.
Sources and data
Eurostat, Individuals - internet activities (isoc_ci_ac_i). Data updated 17 April 2026, retrieved 9 November 2026. Licence: CC BY 4.0.
Eurostat metadata · Eurostat methodology
https://ec.europa.eu/eurostat/api/dissemination/statistics/1.0/data/isoc_ci_ac_i?format=JSON&lang=en&freq=A&geo=AT&geo=BE&geo=BG&geo=CY&geo=CZ&geo=DE&geo=DK&geo=EE&geo=EL&geo=ES&geo=EU27_2020&geo=FI&geo=FR&geo=HR&geo=HU&geo=IE&geo=IT&geo=LT&geo=LU&geo=LV&geo=MT&geo=NL&geo=PL&geo=PT&geo=RO&geo=SE&geo=SI&geo=SK&ind_type=IND_TOTAL&indic_is=I_IUBK&unit=PC_INDEurostat, Individuals who used the internet, frequency of use and activities (isoc_r_iuse_i). Data updated 17 April 2026, retrieved 9 November 2026. Licence: CC BY 4.0.
https://ec.europa.eu/eurostat/api/dissemination/statistics/1.0/data/isoc_r_iuse_i?format=JSON&lang=en&freq=A&geo=AT11&geo=AT12&geo=AT13&geo=AT21&geo=AT22&geo=AT31&geo=AT32&geo=AT33&geo=AT34&geo=BE10&geo=BE21&geo=BE22&geo=BE23&geo=BE24&geo=BE25&geo=BE31&geo=BE32&geo=BE33&geo=BE34&geo=BE35&geo=BG31&geo=BG32&geo=BG33&geo=BG34&geo=BG41&geo=BG42&geo=CY00&geo=CZ01&geo=CZ02&geo=CZ03&geo=CZ04&geo=CZ05&geo=CZ06&geo=CZ07&geo=CZ08&geo=DE1&geo=DE2&geo=DE3&geo=DE4&geo=DE5&geo=DE6&geo=DE7&geo=DE8&geo=DE9&geo=DEA&geo=DEB&geo=DEC&geo=DED&geo=DEE&geo=DEF&geo=DEG&geo=DK01&geo=DK02&geo=DK03&geo=DK04&geo=DK05&geo=EE00&geo=EL1&geo=EL2&geo=EL3&geo=EL4&geo=EL5&geo=EL6&geo=ES11&geo=ES12&geo=ES13&geo=ES21&geo=ES22&geo=ES23&geo=ES24&geo=ES30&geo=ES41&geo=ES42&geo=ES43&geo=ES51&geo=ES52&geo=ES53&geo=ES61&geo=ES62&geo=ES63&geo=ES64&geo=ES70&geo=FI19&geo=FI1B&geo=FI1C&geo=FI1D&geo=FI20&geo=FR10&geo=FRB0&geo=FRC1&geo=FRC2&geo=FRD1&geo=FRD2&geo=FRE1&geo=FRE2&geo=FRF1&geo=FRF2&geo=FRF3&geo=FRG0&geo=FRH0&geo=FRI1&geo=FRI2&geo=FRI3&geo=FRJ1&geo=FRJ2&geo=FRK1&geo=FRK2&geo=FRL0&geo=FRM0&geo=FRY1&geo=FRY2&geo=FRY3&geo=FRY4&geo=HR03&geo=HR04&geo=HR05&geo=HR06&geo=HU10&geo=HU11&geo=HU12&geo=HU21&geo=HU22&geo=HU23&geo=HU31&geo=HU32&geo=HU33&geo=IE01&geo=IE02&geo=IE04&geo=IE05&geo=IE06&geo=ITC1&geo=ITC2&geo=ITC3&geo=ITC4&geo=ITF1&geo=ITF2&geo=ITF3&geo=ITF4&geo=ITF5&geo=ITF6&geo=ITG1&geo=ITG2&geo=ITH1&geo=ITH2&geo=ITH3&geo=ITH4&geo=ITH5&geo=ITI1&geo=ITI2&geo=ITI3&geo=ITI4&geo=LT00&geo=LT01&geo=LT02&geo=LU00&geo=LV00&geo=MT00&geo=NL11&geo=NL12&geo=NL13&geo=NL21&geo=NL22&geo=NL23&geo=NL31&geo=NL32&geo=NL33&geo=NL34&geo=NL35&geo=NL36&geo=NL41&geo=NL42&geo=PL21&geo=PL22&geo=PL41&geo=PL42&geo=PL43&geo=PL51&geo=PL52&geo=PL61&geo=PL62&geo=PL63&geo=PL71&geo=PL72&geo=PL81&geo=PL82&geo=PL84&geo=PL91&geo=PL92&geo=PT11&geo=PT15&geo=PT16&geo=PT17&geo=PT18&geo=PT19&geo=PT1A&geo=PT1B&geo=PT1C&geo=PT1D&geo=PT20&geo=PT30&geo=RO11&geo=RO12&geo=RO21&geo=RO22&geo=RO31&geo=RO32&geo=RO41&geo=RO42&geo=SE11&geo=SE12&geo=SE21&geo=SE22&geo=SE23&geo=SE31&geo=SE32&geo=SE33&geo=SI01&geo=SI02&geo=SI03&geo=SI04&geo=SK01&geo=SK02&geo=SK03&geo=SK04&indic_is=I_IUBK&time=2025&unit=PC_INDRelated stories
-
Shopping online in the EU countries
95.1% of people aged 16 to 74 in Ireland bought something online in a year, against 51.2% in Bulgaria (2025)
-
Who has never been online in the EU
In Croatia, 10.33% of people aged 16 to 74 have never used the internet, against 0.20% in Ireland (2025)
-
Who uses generative AI in the EU countries
In Denmark, the share of people using generative AI is 30.6 percentage points higher than in Romania (2025)
-
Electric cars among new cars in the EU
In Denmark, 67.8% of new cars were battery-only electric, against 1.9% in Croatia (2025)