House prices against household income in the EU countries
Topic: Housing
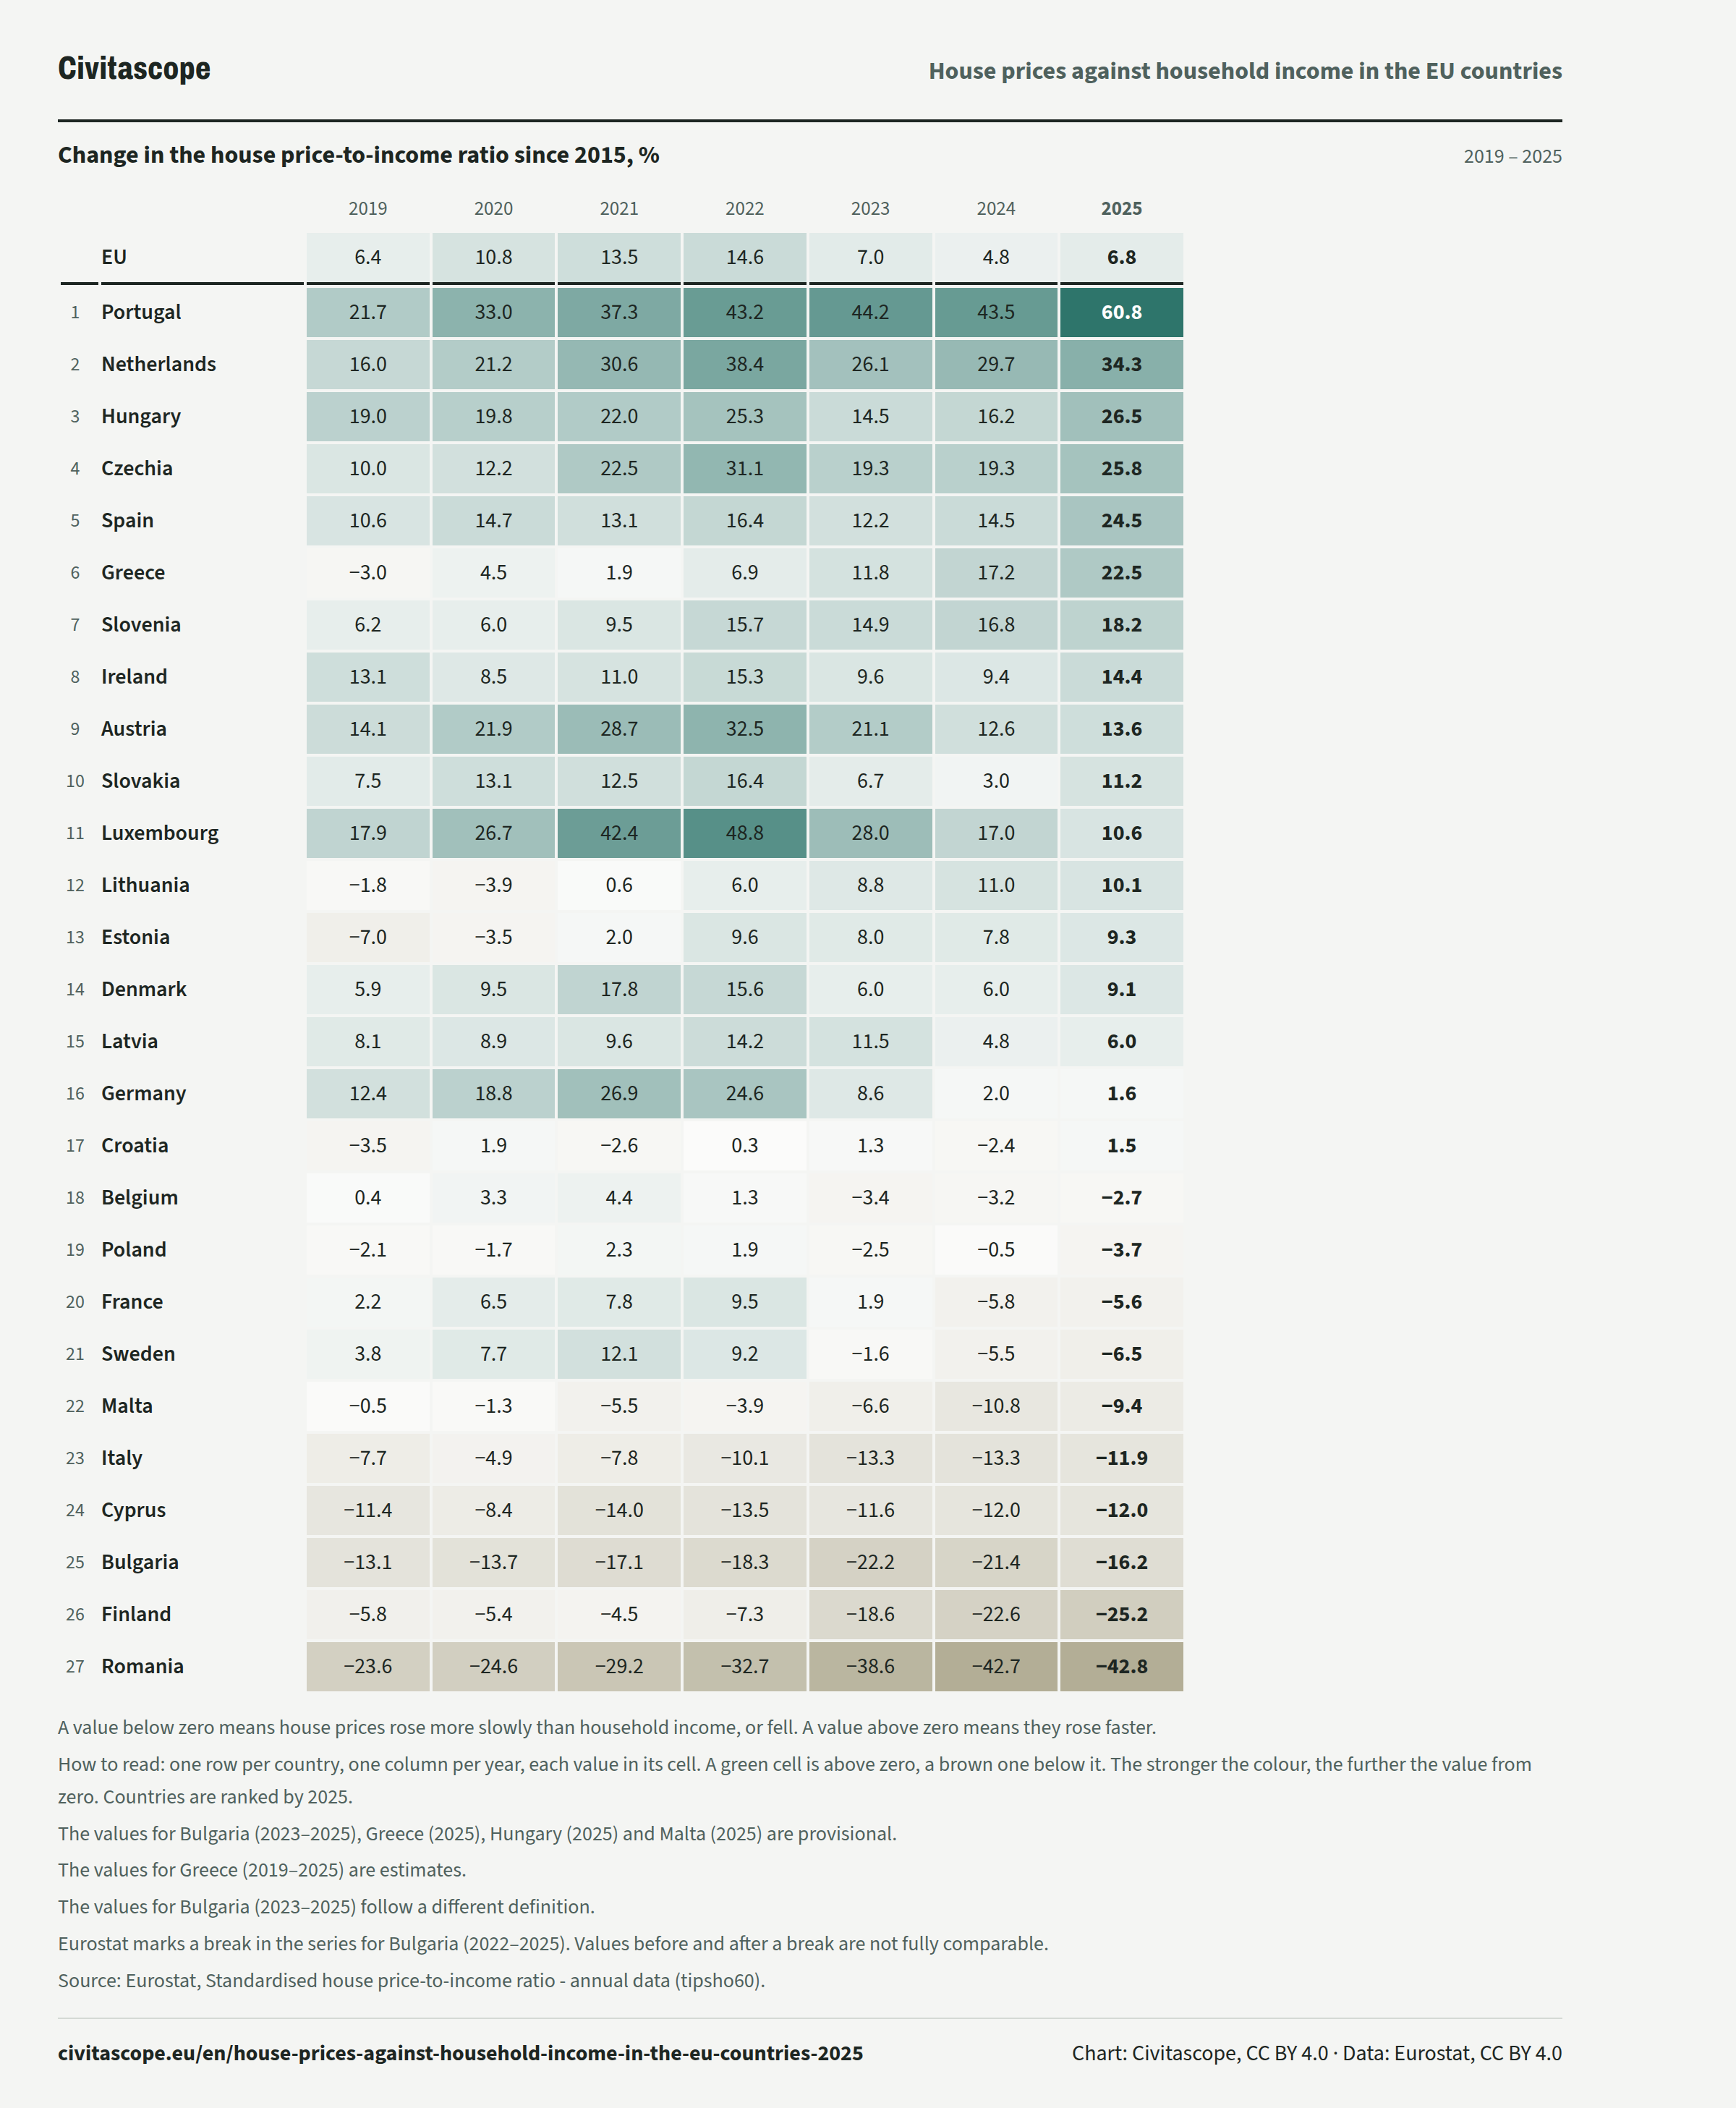
Relative to household income, house prices rose by 60.8% in Portugal and fell by 42.8% in Romania.
Between 2015 and 2025, house prices in the EU rose by 6.8% relative to household income. The house price-to-income ratio rises when house prices rise faster than income.
- Figures for:
- 2015–2025.
- Covers:
- the change between the two dates.
- New data:
- once a year.
- Dataset updated:
- 3 November 2026.
Published 13 November 2026
The ranking
Between 2015 and 2025, the change was highest in Portugal, where house prices rose by 60.8% relative to income, and lowest in Romania, where they fell by 42.8%.
Change in the house price-to-income ratio, %
2015–2025Year by year
Relative to household income, house prices in the EU rose by 6.4% between 2015 and 2019 and by 6.8% between 2015 and 2025.
Change in the house price-to-income ratio since 2015, %
2019 – 2025| 2019 | 2020 | 2021 | 2022 | 2023 | 2024 | 2025 | ||
|---|---|---|---|---|---|---|---|---|
| EU, | 2019: 6.4%, | 2020: 10.8%, | 2021: 13.5%, | 2022: 14.6%, | 2023: 7.0%, | 2024: 4.8%, | 2025: 6.8%, | |
| Rank 1: | Portugal, | 2019: 21.7%, | 2020: 33.0%, | 2021: 37.3%, | 2022: 43.2%, | 2023: 44.2%, | 2024: 43.5%, | 2025: 60.8%, |
| Rank 2: | Netherlands, | 2019: 16.0%, | 2020: 21.2%, | 2021: 30.6%, | 2022: 38.4%, | 2023: 26.1%, | 2024: 29.7%, | 2025: 34.3%, |
| Rank 3: | Hungary, | 2019: 19.0%, | 2020: 19.8%, | 2021: 22.0%, | 2022: 25.3%, | 2023: 14.5%, | 2024: 16.2%, | 2025: 26.5%, |
| Rank 4: | Czechia, | 2019: 10.0%, | 2020: 12.2%, | 2021: 22.5%, | 2022: 31.1%, | 2023: 19.3%, | 2024: 19.3%, | 2025: 25.8%, |
| Rank 5: | Spain, | 2019: 10.6%, | 2020: 14.7%, | 2021: 13.1%, | 2022: 16.4%, | 2023: 12.2%, | 2024: 14.5%, | 2025: 24.5%, |
| Rank 6: | Greece, | 2019: −3.0%, | 2020: 4.5%, | 2021: 1.9%, | 2022: 6.9%, | 2023: 11.8%, | 2024: 17.2%, | 2025: 22.5%, |
| Rank 7: | Slovenia, | 2019: 6.2%, | 2020: 6.0%, | 2021: 9.5%, | 2022: 15.7%, | 2023: 14.9%, | 2024: 16.8%, | 2025: 18.2%, |
| Rank 8: | Ireland, | 2019: 13.1%, | 2020: 8.5%, | 2021: 11.0%, | 2022: 15.3%, | 2023: 9.6%, | 2024: 9.4%, | 2025: 14.4%, |
| Rank 9: | Austria, | 2019: 14.1%, | 2020: 21.9%, | 2021: 28.7%, | 2022: 32.5%, | 2023: 21.1%, | 2024: 12.6%, | 2025: 13.6%, |
| Rank 10: | Slovakia, | 2019: 7.5%, | 2020: 13.1%, | 2021: 12.5%, | 2022: 16.4%, | 2023: 6.7%, | 2024: 3.0%, | 2025: 11.2%, |
| Rank 11: | Luxembourg, | 2019: 17.9%, | 2020: 26.7%, | 2021: 42.4%, | 2022: 48.8%, | 2023: 28.0%, | 2024: 17.0%, | 2025: 10.6%, |
| Rank 12: | Lithuania, | 2019: −1.8%, | 2020: −3.9%, | 2021: 0.6%, | 2022: 6.0%, | 2023: 8.8%, | 2024: 11.0%, | 2025: 10.1%, |
| Rank 13: | Estonia, | 2019: −7.0%, | 2020: −3.5%, | 2021: 2.0%, | 2022: 9.6%, | 2023: 8.0%, | 2024: 7.8%, | 2025: 9.3%, |
| Rank 14: | Denmark, | 2019: 5.9%, | 2020: 9.5%, | 2021: 17.8%, | 2022: 15.6%, | 2023: 6.0%, | 2024: 6.0%, | 2025: 9.1%, |
| Rank 15: | Latvia, | 2019: 8.1%, | 2020: 8.9%, | 2021: 9.6%, | 2022: 14.2%, | 2023: 11.5%, | 2024: 4.8%, | 2025: 6.0%, |
| Rank 16: | Germany, | 2019: 12.4%, | 2020: 18.8%, | 2021: 26.9%, | 2022: 24.6%, | 2023: 8.6%, | 2024: 2.0%, | 2025: 1.6%, |
| Rank 17: | Croatia, | 2019: −3.5%, | 2020: 1.9%, | 2021: −2.6%, | 2022: 0.3%, | 2023: 1.3%, | 2024: −2.4%, | 2025: 1.5%, |
| Rank 18: | Belgium, | 2019: 0.4%, | 2020: 3.3%, | 2021: 4.4%, | 2022: 1.3%, | 2023: −3.4%, | 2024: −3.2%, | 2025: −2.7%, |
| Rank 19: | Poland, | 2019: −2.1%, | 2020: −1.7%, | 2021: 2.3%, | 2022: 1.9%, | 2023: −2.5%, | 2024: −0.5%, | 2025: −3.7%, |
| Rank 20: | France, | 2019: 2.2%, | 2020: 6.5%, | 2021: 7.8%, | 2022: 9.5%, | 2023: 1.9%, | 2024: −5.8%, | 2025: −5.6%, |
| Rank 21: | Sweden, | 2019: 3.8%, | 2020: 7.7%, | 2021: 12.1%, | 2022: 9.2%, | 2023: −1.6%, | 2024: −5.5%, | 2025: −6.5%, |
| Rank 22: | Malta, | 2019: −0.5%, | 2020: −1.3%, | 2021: −5.5%, | 2022: −3.9%, | 2023: −6.6%, | 2024: −10.8%, | 2025: −9.4%, |
| Rank 23: | Italy, | 2019: −7.7%, | 2020: −4.9%, | 2021: −7.8%, | 2022: −10.1%, | 2023: −13.3%, | 2024: −13.3%, | 2025: −11.9%, |
| Rank 24: | Cyprus, | 2019: −11.4%, | 2020: −8.4%, | 2021: −14.0%, | 2022: −13.5%, | 2023: −11.6%, | 2024: −12.0%, | 2025: −12.0%, |
| Rank 25: | Bulgaria, | 2019: −13.1%, | 2020: −13.7%, | 2021: −17.1%, | 2022: −18.3%, | 2023: −22.2%, | 2024: −21.4%, | 2025: −16.2%, |
| Rank 26: | Finland, | 2019: −5.8%, | 2020: −5.4%, | 2021: −4.5%, | 2022: −7.3%, | 2023: −18.6%, | 2024: −22.6%, | 2025: −25.2%, |
| Rank 27: | Romania, | 2019: −23.6%, | 2020: −24.6%, | 2021: −29.2%, | 2022: −32.7%, | 2023: −38.6%, | 2024: −42.7%, | 2025: −42.8%, |
About the data
The house price index set against the income of households per inhabitant, as an index. The ratio rises when house prices rise faster than income, or fall more slowly, and it falls when they rise more slowly.
Eurostat: “The house price-to-income ratio compares changes in house prices with changes in per capita household income, relative to a base year. It increases when house prices rise faster (or fall more slowly) than income, decreases when they rise more slowly, and remains unchanged when both change at the same rate.” (source)
Eurostat's house price index and, from the national accounts, the adjusted gross disposable income of households and non-profit institutions serving households per inhabitant. Adjusted income includes the goods and services that households receive free of charge from the government and from those institutions.
How to read these numbers
How it is measured
The figures compare how house prices changed with how income changed over time. They do not rank countries by how expensive homes are in relation to income.
The ratio describes one dimension of housing affordability. Others are the number of years of income needed to buy a dwelling and the cost of financing the purchase through a mortgage.
Income is the adjusted gross disposable income of households per inhabitant from the national accounts. Besides income in money, it includes social transfers in kind, which are the goods and services that households receive from the government without paying for them. It is an average for the whole population, not the pay of people in work.
The index covers dwellings bought by households at market prices, new and existing, whether to live in or to let. The price is that of the dwelling itself, land included. Other costs of buying a dwelling are left out, and so are self-built dwellings.
The figures change when the house price index or the national accounts are revised, even where no value is marked provisional.
France's index covers the European part of the country, without the overseas regions. Italy's leaves out the provinces of Trento and Bolzano and a few municipalities with a different cadastral system. Cyprus's index covers only the areas controlled by the government of the Republic of Cyprus. Finland's leaves out the autonomous region of Åland. Germany's index left out sales in Baden-Württemberg's municipalities of fewer than 20,000 inhabitants until the index for the first quarter of 2026.
Estimates
Greece's figures are Eurostat estimates from the Bank of Greece's index of apartment prices, which rests on valuations (flag e). Greece has no harmonised house price index of its own. This concerns Greece (2015, 2019–2025).
Different definitions
Eurostat marks Bulgaria's values for 2023 to 2025 as following a different definition (flag d). Eurostat's database has Bulgaria's adjusted household income only up to 2022. This concerns Bulgaria (2023–2025).
Breaks in the series
A break in the series (flag b) means that a value is not fully comparable with the periods before it. This concerns Bulgaria (2022).
Provisional figures
A provisional value (flag p) may still be revised. This concerns Bulgaria (2023–2025), Greece (2025), Hungary (2025) and Malta (2025).
Sources and data
Eurostat, Standardised house price-to-income ratio - annual data (tipsho60). Data updated 3 November 2026, retrieved 13 November 2026. Licence: CC BY 4.0.
Eurostat metadata · Eurostat methodology
https://ec.europa.eu/eurostat/api/dissemination/statistics/1.0/data/tipsho60?format=JSON&lang=en&freq=A&geo=AT&geo=BE&geo=BG&geo=CY&geo=CZ&geo=DE&geo=DK&geo=EE&geo=EL&geo=ES&geo=EU27_2020&geo=FI&geo=FR&geo=HR&geo=HU&geo=IE&geo=IT&geo=LT&geo=LU&geo=LV&geo=MT&geo=NL&geo=PL&geo=PT&geo=RO&geo=SE&geo=SI&geo=SK&unit=PTIR_I25Report an error: contact [at] civitascope.eu
Related stories
-
Housing costs as a share of income in the EU
In Greece, housing costs take 34.6% of disposable household income on average, against 10.9% in Cyprus (2025)
-
How fast house prices rose in the EU countries
House prices rose by 18.3% in Hungary and fell by 2.3% in Finland (2025)
-
Who owns their home and who rents in the EU
In Slovakia, 93.8% of people live in a home their household owns, against 47.2% in Germany (2025)
-
Housing costs over 40% of income in the EU countries
In Greece, 26.4% of people live in households that spend more than 40% of their income on housing, against 2.4% in Cyprus (2025)