How satisfied people are with their lives
Topic: Living conditions
In Finland and Romania, people rate their life 7.8 out of 10 on average, against 6.3 out of 10 in Bulgaria.
In 2025, the average overall life satisfaction of people aged 16 or over in the EU was 7.2 out of 10. People give the rating themselves in a survey.
- Figures for:
- 2025.
- Covers:
- the time of the survey.
- New data:
- once a year.
- Dataset updated:
- 20 October 2026.
Published 3 November 2026
The ranking
In 2025, the average overall life satisfaction of people aged 16 or over ranged from 6.3 out of 10 in Bulgaria to 7.8 out of 10 in Finland and Romania.
Average overall life satisfaction of people aged 16 or over, out of 10
2025Young and old
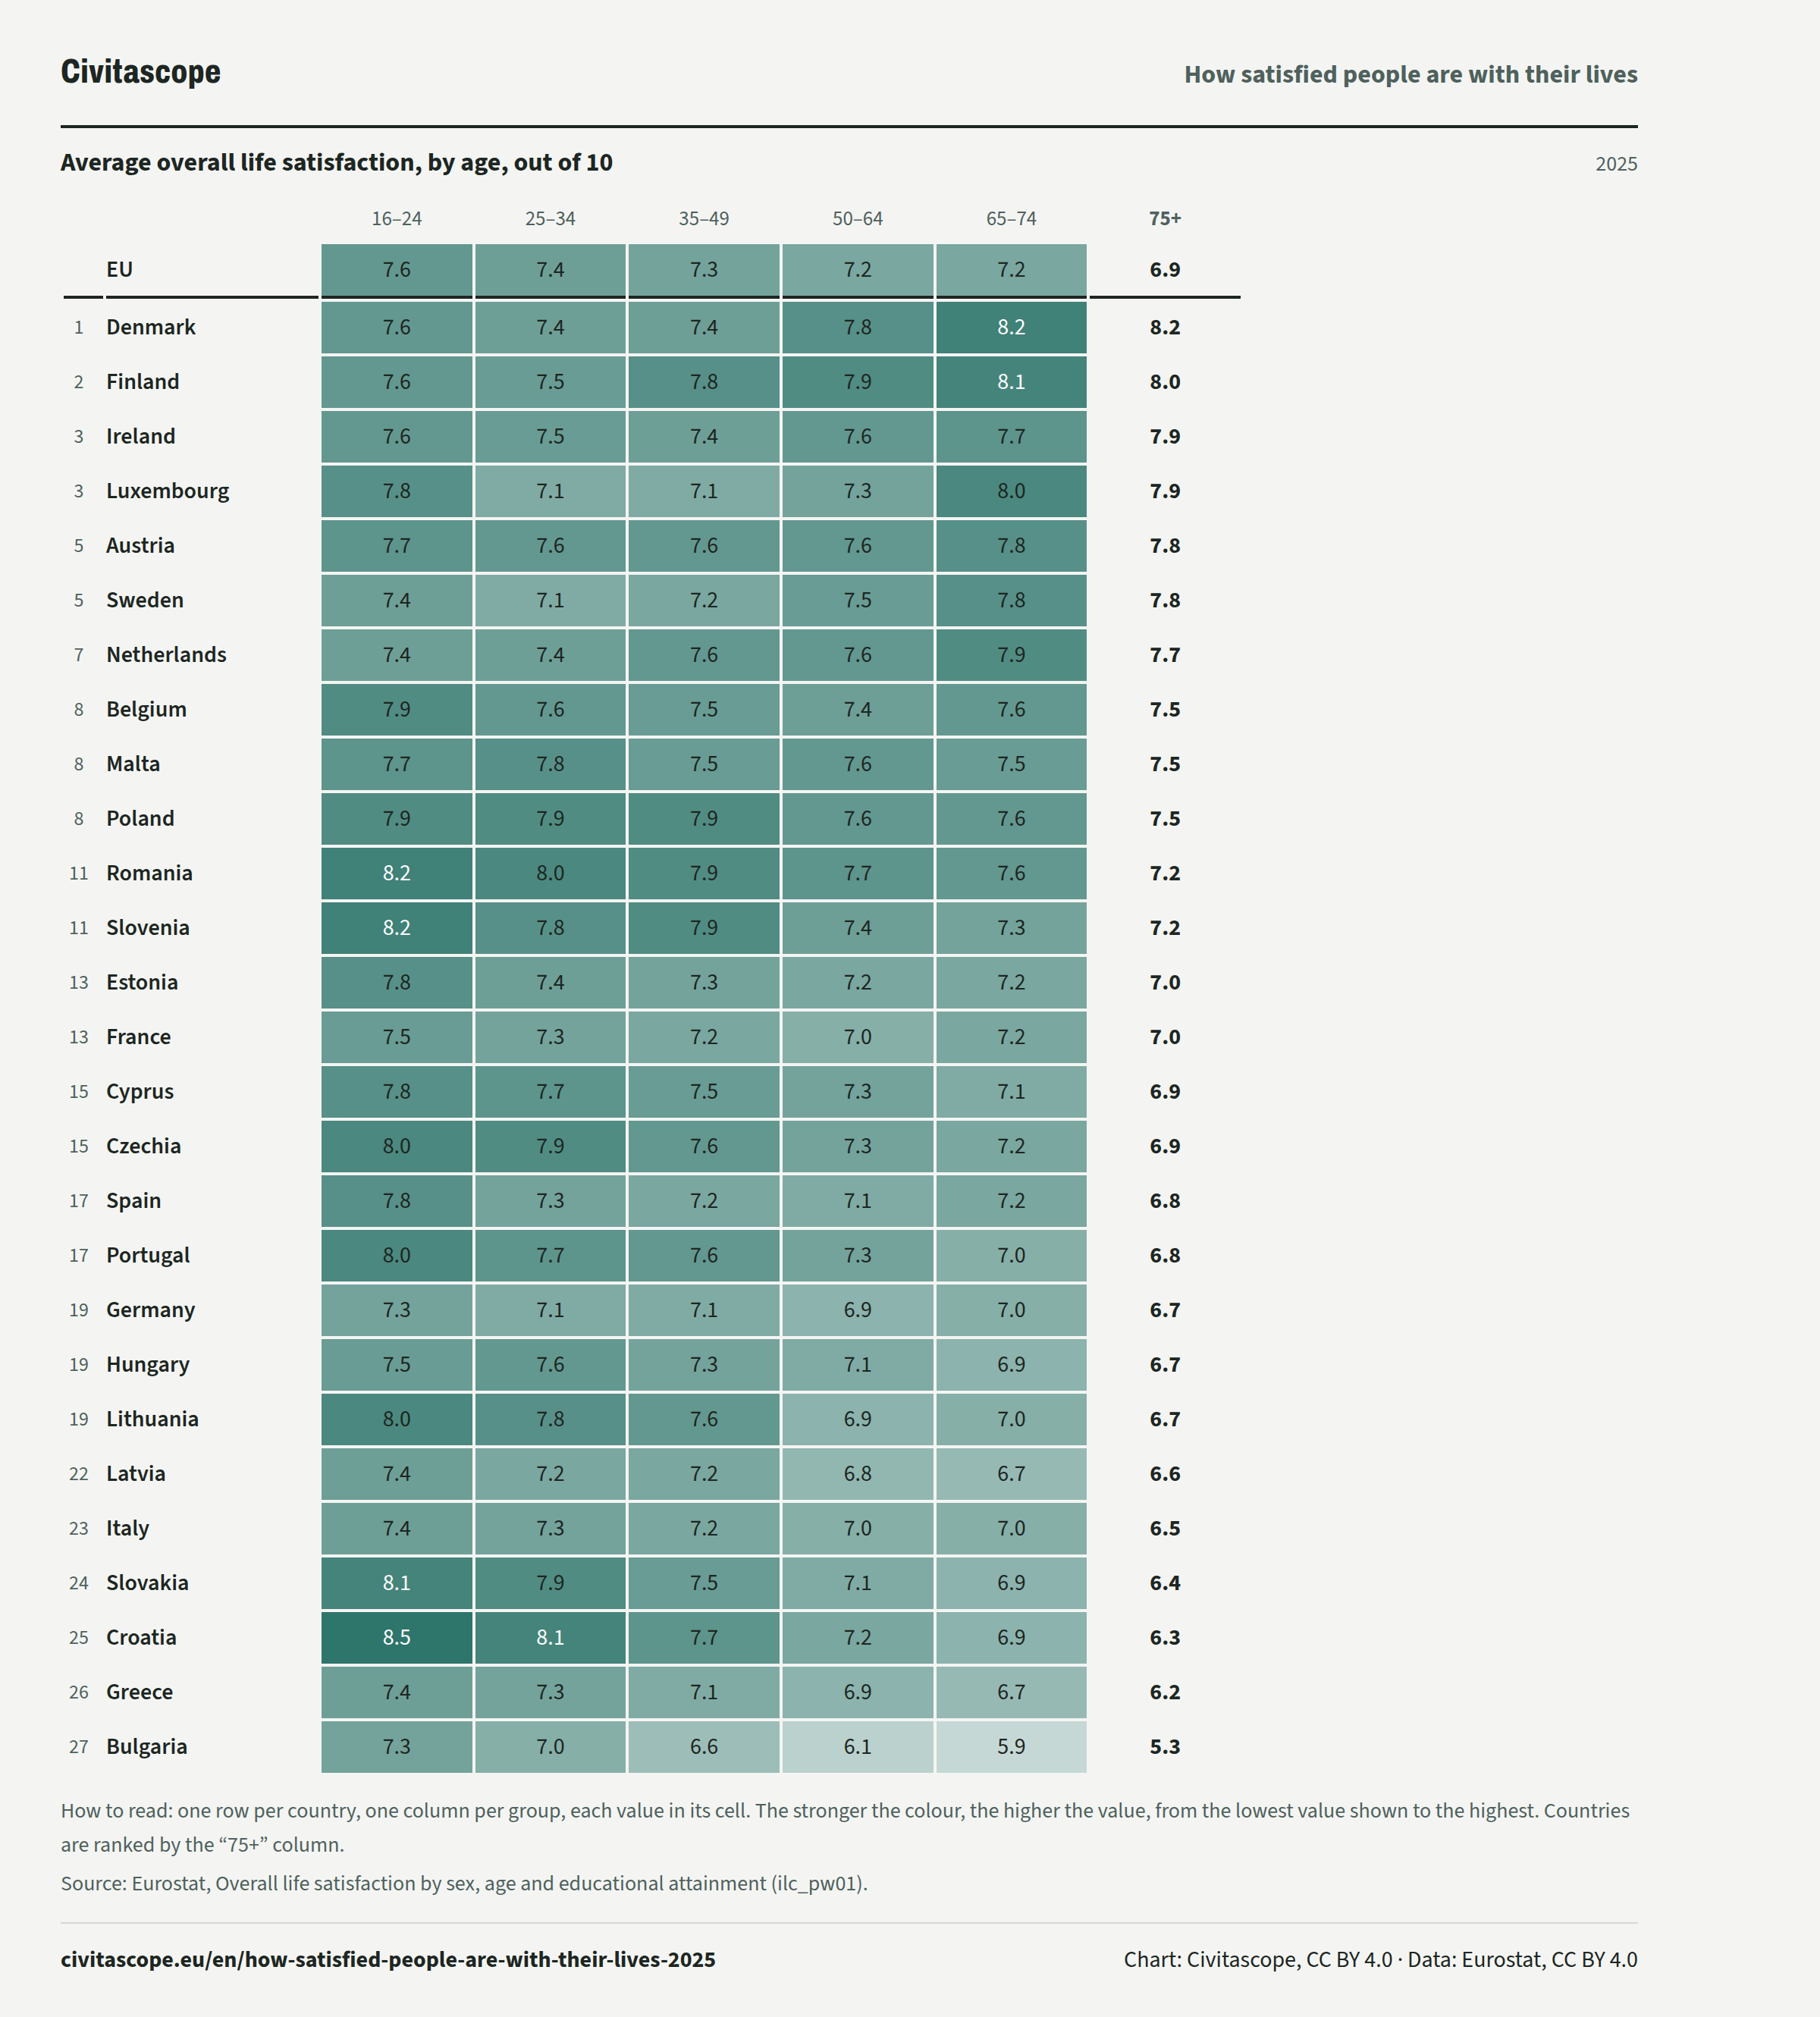
In 2025, people aged 16 to 24 in the EU rated their life 7.6 out of 10 on average, against 6.9 out of 10 for people aged 75 or over.
Average overall life satisfaction, by age, out of 10
2025| 16–24 | 25–34 | 35–49 | 50–64 | 65–74 | 75+ | ||
|---|---|---|---|---|---|---|---|
| EU, | 16–24: 7.6 out of 10, | 25–34: 7.4 out of 10, | 35–49: 7.3 out of 10, | 50–64: 7.2 out of 10, | 65–74: 7.2 out of 10, | 75+: 6.9 out of 10, | |
| Rank 1: | Denmark, | 16–24: 7.6 out of 10, | 25–34: 7.4 out of 10, | 35–49: 7.4 out of 10, | 50–64: 7.8 out of 10, | 65–74: 8.2 out of 10, | 75+: 8.2 out of 10, |
| Rank 2: | Finland, | 16–24: 7.6 out of 10, | 25–34: 7.5 out of 10, | 35–49: 7.8 out of 10, | 50–64: 7.9 out of 10, | 65–74: 8.1 out of 10, | 75+: 8.0 out of 10, |
| Rank 3: | Ireland, | 16–24: 7.6 out of 10, | 25–34: 7.5 out of 10, | 35–49: 7.4 out of 10, | 50–64: 7.6 out of 10, | 65–74: 7.7 out of 10, | 75+: 7.9 out of 10, |
| Rank 3: | Luxembourg, | 16–24: 7.8 out of 10, | 25–34: 7.1 out of 10, | 35–49: 7.1 out of 10, | 50–64: 7.3 out of 10, | 65–74: 8.0 out of 10, | 75+: 7.9 out of 10, |
| Rank 5: | Austria, | 16–24: 7.7 out of 10, | 25–34: 7.6 out of 10, | 35–49: 7.6 out of 10, | 50–64: 7.6 out of 10, | 65–74: 7.8 out of 10, | 75+: 7.8 out of 10, |
| Rank 5: | Sweden, | 16–24: 7.4 out of 10, | 25–34: 7.1 out of 10, | 35–49: 7.2 out of 10, | 50–64: 7.5 out of 10, | 65–74: 7.8 out of 10, | 75+: 7.8 out of 10, |
| Rank 7: | Netherlands, | 16–24: 7.4 out of 10, | 25–34: 7.4 out of 10, | 35–49: 7.6 out of 10, | 50–64: 7.6 out of 10, | 65–74: 7.9 out of 10, | 75+: 7.7 out of 10, |
| Rank 8: | Belgium, | 16–24: 7.9 out of 10, | 25–34: 7.6 out of 10, | 35–49: 7.5 out of 10, | 50–64: 7.4 out of 10, | 65–74: 7.6 out of 10, | 75+: 7.5 out of 10, |
| Rank 8: | Malta, | 16–24: 7.7 out of 10, | 25–34: 7.8 out of 10, | 35–49: 7.5 out of 10, | 50–64: 7.6 out of 10, | 65–74: 7.5 out of 10, | 75+: 7.5 out of 10, |
| Rank 8: | Poland, | 16–24: 7.9 out of 10, | 25–34: 7.9 out of 10, | 35–49: 7.9 out of 10, | 50–64: 7.6 out of 10, | 65–74: 7.6 out of 10, | 75+: 7.5 out of 10, |
| Rank 11: | Romania, | 16–24: 8.2 out of 10, | 25–34: 8.0 out of 10, | 35–49: 7.9 out of 10, | 50–64: 7.7 out of 10, | 65–74: 7.6 out of 10, | 75+: 7.2 out of 10, |
| Rank 11: | Slovenia, | 16–24: 8.2 out of 10, | 25–34: 7.8 out of 10, | 35–49: 7.9 out of 10, | 50–64: 7.4 out of 10, | 65–74: 7.3 out of 10, | 75+: 7.2 out of 10, |
| Rank 13: | Estonia, | 16–24: 7.8 out of 10, | 25–34: 7.4 out of 10, | 35–49: 7.3 out of 10, | 50–64: 7.2 out of 10, | 65–74: 7.2 out of 10, | 75+: 7.0 out of 10, |
| Rank 13: | France, | 16–24: 7.5 out of 10, | 25–34: 7.3 out of 10, | 35–49: 7.2 out of 10, | 50–64: 7.0 out of 10, | 65–74: 7.2 out of 10, | 75+: 7.0 out of 10, |
| Rank 15: | Cyprus, | 16–24: 7.8 out of 10, | 25–34: 7.7 out of 10, | 35–49: 7.5 out of 10, | 50–64: 7.3 out of 10, | 65–74: 7.1 out of 10, | 75+: 6.9 out of 10, |
| Rank 15: | Czechia, | 16–24: 8.0 out of 10, | 25–34: 7.9 out of 10, | 35–49: 7.6 out of 10, | 50–64: 7.3 out of 10, | 65–74: 7.2 out of 10, | 75+: 6.9 out of 10, |
| Rank 17: | Spain, | 16–24: 7.8 out of 10, | 25–34: 7.3 out of 10, | 35–49: 7.2 out of 10, | 50–64: 7.1 out of 10, | 65–74: 7.2 out of 10, | 75+: 6.8 out of 10, |
| Rank 17: | Portugal, | 16–24: 8.0 out of 10, | 25–34: 7.7 out of 10, | 35–49: 7.6 out of 10, | 50–64: 7.3 out of 10, | 65–74: 7.0 out of 10, | 75+: 6.8 out of 10, |
| Rank 19: | Germany, | 16–24: 7.3 out of 10, | 25–34: 7.1 out of 10, | 35–49: 7.1 out of 10, | 50–64: 6.9 out of 10, | 65–74: 7.0 out of 10, | 75+: 6.7 out of 10, |
| Rank 19: | Hungary, | 16–24: 7.5 out of 10, | 25–34: 7.6 out of 10, | 35–49: 7.3 out of 10, | 50–64: 7.1 out of 10, | 65–74: 6.9 out of 10, | 75+: 6.7 out of 10, |
| Rank 19: | Lithuania, | 16–24: 8.0 out of 10, | 25–34: 7.8 out of 10, | 35–49: 7.6 out of 10, | 50–64: 6.9 out of 10, | 65–74: 7.0 out of 10, | 75+: 6.7 out of 10, |
| Rank 22: | Latvia, | 16–24: 7.4 out of 10, | 25–34: 7.2 out of 10, | 35–49: 7.2 out of 10, | 50–64: 6.8 out of 10, | 65–74: 6.7 out of 10, | 75+: 6.6 out of 10, |
| Rank 23: | Italy, | 16–24: 7.4 out of 10, | 25–34: 7.3 out of 10, | 35–49: 7.2 out of 10, | 50–64: 7.0 out of 10, | 65–74: 7.0 out of 10, | 75+: 6.5 out of 10, |
| Rank 24: | Slovakia, | 16–24: 8.1 out of 10, | 25–34: 7.9 out of 10, | 35–49: 7.5 out of 10, | 50–64: 7.1 out of 10, | 65–74: 6.9 out of 10, | 75+: 6.4 out of 10, |
| Rank 25: | Croatia, | 16–24: 8.5 out of 10, | 25–34: 8.1 out of 10, | 35–49: 7.7 out of 10, | 50–64: 7.2 out of 10, | 65–74: 6.9 out of 10, | 75+: 6.3 out of 10, |
| Rank 26: | Greece, | 16–24: 7.4 out of 10, | 25–34: 7.3 out of 10, | 35–49: 7.1 out of 10, | 50–64: 6.9 out of 10, | 65–74: 6.7 out of 10, | 75+: 6.2 out of 10, |
| Rank 27: | Bulgaria, | 16–24: 7.3 out of 10, | 25–34: 7.0 out of 10, | 35–49: 6.6 out of 10, | 50–64: 6.1 out of 10, | 65–74: 5.9 out of 10, | 75+: 5.3 out of 10, |
| 16–24 | 25–34 | 35–49 | 75+ | ||
|---|---|---|---|---|---|
| EU, | 16–24: 7.6 out of 10, | 25–34: 7.4 out of 10, | 35–49: 7.3 out of 10, | 75+: 6.9 out of 10, | |
| Rank 1: | Denmark, | 16–24: 7.6 out of 10, | 25–34: 7.4 out of 10, | 35–49: 7.4 out of 10, | 75+: 8.2 out of 10, |
| Rank 2: | Finland, | 16–24: 7.6 out of 10, | 25–34: 7.5 out of 10, | 35–49: 7.8 out of 10, | 75+: 8.0 out of 10, |
| Rank 3: | Ireland, | 16–24: 7.6 out of 10, | 25–34: 7.5 out of 10, | 35–49: 7.4 out of 10, | 75+: 7.9 out of 10, |
| Rank 3: | Luxembourg, | 16–24: 7.8 out of 10, | 25–34: 7.1 out of 10, | 35–49: 7.1 out of 10, | 75+: 7.9 out of 10, |
| Rank 5: | Austria, | 16–24: 7.7 out of 10, | 25–34: 7.6 out of 10, | 35–49: 7.6 out of 10, | 75+: 7.8 out of 10, |
| Rank 5: | Sweden, | 16–24: 7.4 out of 10, | 25–34: 7.1 out of 10, | 35–49: 7.2 out of 10, | 75+: 7.8 out of 10, |
| Rank 7: | Netherlands, | 16–24: 7.4 out of 10, | 25–34: 7.4 out of 10, | 35–49: 7.6 out of 10, | 75+: 7.7 out of 10, |
| Rank 8: | Belgium, | 16–24: 7.9 out of 10, | 25–34: 7.6 out of 10, | 35–49: 7.5 out of 10, | 75+: 7.5 out of 10, |
| Rank 8: | Malta, | 16–24: 7.7 out of 10, | 25–34: 7.8 out of 10, | 35–49: 7.5 out of 10, | 75+: 7.5 out of 10, |
| Rank 8: | Poland, | 16–24: 7.9 out of 10, | 25–34: 7.9 out of 10, | 35–49: 7.9 out of 10, | 75+: 7.5 out of 10, |
| Rank 11: | Romania, | 16–24: 8.2 out of 10, | 25–34: 8.0 out of 10, | 35–49: 7.9 out of 10, | 75+: 7.2 out of 10, |
| Rank 11: | Slovenia, | 16–24: 8.2 out of 10, | 25–34: 7.8 out of 10, | 35–49: 7.9 out of 10, | 75+: 7.2 out of 10, |
| Rank 13: | Estonia, | 16–24: 7.8 out of 10, | 25–34: 7.4 out of 10, | 35–49: 7.3 out of 10, | 75+: 7.0 out of 10, |
| Rank 13: | France, | 16–24: 7.5 out of 10, | 25–34: 7.3 out of 10, | 35–49: 7.2 out of 10, | 75+: 7.0 out of 10, |
| Rank 15: | Cyprus, | 16–24: 7.8 out of 10, | 25–34: 7.7 out of 10, | 35–49: 7.5 out of 10, | 75+: 6.9 out of 10, |
| Rank 15: | Czechia, | 16–24: 8.0 out of 10, | 25–34: 7.9 out of 10, | 35–49: 7.6 out of 10, | 75+: 6.9 out of 10, |
| Rank 17: | Spain, | 16–24: 7.8 out of 10, | 25–34: 7.3 out of 10, | 35–49: 7.2 out of 10, | 75+: 6.8 out of 10, |
| Rank 17: | Portugal, | 16–24: 8.0 out of 10, | 25–34: 7.7 out of 10, | 35–49: 7.6 out of 10, | 75+: 6.8 out of 10, |
| Rank 19: | Germany, | 16–24: 7.3 out of 10, | 25–34: 7.1 out of 10, | 35–49: 7.1 out of 10, | 75+: 6.7 out of 10, |
| Rank 19: | Hungary, | 16–24: 7.5 out of 10, | 25–34: 7.6 out of 10, | 35–49: 7.3 out of 10, | 75+: 6.7 out of 10, |
| Rank 19: | Lithuania, | 16–24: 8.0 out of 10, | 25–34: 7.8 out of 10, | 35–49: 7.6 out of 10, | 75+: 6.7 out of 10, |
| Rank 22: | Latvia, | 16–24: 7.4 out of 10, | 25–34: 7.2 out of 10, | 35–49: 7.2 out of 10, | 75+: 6.6 out of 10, |
| Rank 23: | Italy, | 16–24: 7.4 out of 10, | 25–34: 7.3 out of 10, | 35–49: 7.2 out of 10, | 75+: 6.5 out of 10, |
| Rank 24: | Slovakia, | 16–24: 8.1 out of 10, | 25–34: 7.9 out of 10, | 35–49: 7.5 out of 10, | 75+: 6.4 out of 10, |
| Rank 25: | Croatia, | 16–24: 8.5 out of 10, | 25–34: 8.1 out of 10, | 35–49: 7.7 out of 10, | 75+: 6.3 out of 10, |
| Rank 26: | Greece, | 16–24: 7.4 out of 10, | 25–34: 7.3 out of 10, | 35–49: 7.1 out of 10, | 75+: 6.2 out of 10, |
| Rank 27: | Bulgaria, | 16–24: 7.3 out of 10, | 25–34: 7.0 out of 10, | 35–49: 6.6 out of 10, | 75+: 5.3 out of 10, |
| 50–64 | 65–74 | 75+ | ||
|---|---|---|---|---|
| EU, | 50–64: 7.2 out of 10, | 65–74: 7.2 out of 10, | 75+: 6.9 out of 10, | |
| Rank 1: | Denmark, | 50–64: 7.8 out of 10, | 65–74: 8.2 out of 10, | 75+: 8.2 out of 10, |
| Rank 2: | Finland, | 50–64: 7.9 out of 10, | 65–74: 8.1 out of 10, | 75+: 8.0 out of 10, |
| Rank 3: | Ireland, | 50–64: 7.6 out of 10, | 65–74: 7.7 out of 10, | 75+: 7.9 out of 10, |
| Rank 3: | Luxembourg, | 50–64: 7.3 out of 10, | 65–74: 8.0 out of 10, | 75+: 7.9 out of 10, |
| Rank 5: | Austria, | 50–64: 7.6 out of 10, | 65–74: 7.8 out of 10, | 75+: 7.8 out of 10, |
| Rank 5: | Sweden, | 50–64: 7.5 out of 10, | 65–74: 7.8 out of 10, | 75+: 7.8 out of 10, |
| Rank 7: | Netherlands, | 50–64: 7.6 out of 10, | 65–74: 7.9 out of 10, | 75+: 7.7 out of 10, |
| Rank 8: | Belgium, | 50–64: 7.4 out of 10, | 65–74: 7.6 out of 10, | 75+: 7.5 out of 10, |
| Rank 8: | Malta, | 50–64: 7.6 out of 10, | 65–74: 7.5 out of 10, | 75+: 7.5 out of 10, |
| Rank 8: | Poland, | 50–64: 7.6 out of 10, | 65–74: 7.6 out of 10, | 75+: 7.5 out of 10, |
| Rank 11: | Romania, | 50–64: 7.7 out of 10, | 65–74: 7.6 out of 10, | 75+: 7.2 out of 10, |
| Rank 11: | Slovenia, | 50–64: 7.4 out of 10, | 65–74: 7.3 out of 10, | 75+: 7.2 out of 10, |
| Rank 13: | Estonia, | 50–64: 7.2 out of 10, | 65–74: 7.2 out of 10, | 75+: 7.0 out of 10, |
| Rank 13: | France, | 50–64: 7.0 out of 10, | 65–74: 7.2 out of 10, | 75+: 7.0 out of 10, |
| Rank 15: | Cyprus, | 50–64: 7.3 out of 10, | 65–74: 7.1 out of 10, | 75+: 6.9 out of 10, |
| Rank 15: | Czechia, | 50–64: 7.3 out of 10, | 65–74: 7.2 out of 10, | 75+: 6.9 out of 10, |
| Rank 17: | Spain, | 50–64: 7.1 out of 10, | 65–74: 7.2 out of 10, | 75+: 6.8 out of 10, |
| Rank 17: | Portugal, | 50–64: 7.3 out of 10, | 65–74: 7.0 out of 10, | 75+: 6.8 out of 10, |
| Rank 19: | Germany, | 50–64: 6.9 out of 10, | 65–74: 7.0 out of 10, | 75+: 6.7 out of 10, |
| Rank 19: | Hungary, | 50–64: 7.1 out of 10, | 65–74: 6.9 out of 10, | 75+: 6.7 out of 10, |
| Rank 19: | Lithuania, | 50–64: 6.9 out of 10, | 65–74: 7.0 out of 10, | 75+: 6.7 out of 10, |
| Rank 22: | Latvia, | 50–64: 6.8 out of 10, | 65–74: 6.7 out of 10, | 75+: 6.6 out of 10, |
| Rank 23: | Italy, | 50–64: 7.0 out of 10, | 65–74: 7.0 out of 10, | 75+: 6.5 out of 10, |
| Rank 24: | Slovakia, | 50–64: 7.1 out of 10, | 65–74: 6.9 out of 10, | 75+: 6.4 out of 10, |
| Rank 25: | Croatia, | 50–64: 7.2 out of 10, | 65–74: 6.9 out of 10, | 75+: 6.3 out of 10, |
| Rank 26: | Greece, | 50–64: 6.9 out of 10, | 65–74: 6.7 out of 10, | 75+: 6.2 out of 10, |
| Rank 27: | Bulgaria, | 50–64: 6.1 out of 10, | 65–74: 5.9 out of 10, | 75+: 5.3 out of 10, |
Level of education
In 2025, people in the EU with at most lower secondary education rated their life 6.9 out of 10 on average, against 7.6 out of 10 for people with tertiary education.
Average overall life satisfaction, by level of education, out of 10
2025About the data
The average rating that people aged 16 or over living in private households give to their satisfaction with their life as a whole, on a scale from zero (not at all satisfied) to ten (completely satisfied).
Eurostat: “life satisfaction (or life evaluation) – an overall assessment of one’s life;” (source)
EU statistics on income and living conditions (EU-SILC), a yearly sample survey of households run by the national statistical institutes. Every household member aged 16 or over is interviewed. The rating is the person's own assessment.
How to read these numbers
How it is measured
The survey covers people aged 16 or over living in private households. People in collective households and institutions are generally not included (Estonia includes collective households).
The figure is the average of people's own ratings. Life satisfaction has no objectively measurable counterpart. A rating may depend on the timing and circumstances of the interview. Norms and cultural backgrounds differ between countries and shape what people value.
The survey asks about life satisfaction every year since 2021. The values for 2013 and 2018 come from special survey modules on well-being, and there are no values for the years between. Since 2021 another household member may answer for a person as an exception. There is no EU figure for 2021. Germany and Portugal have no published value for 2021 either.
Low reliability
Eurostat marks every value for France, Hungary, Poland and Portugal since 2021 as of low reliability (flag u), and every value for Germany in 2021 to 2023. Eurostat's publication rules mark a value so when it rests on few survey answers, or when many of the people asked did not answer the question. Eurostat does not say which applies to these countries. This concerns France (2025), Hungary (2025), Poland (2025) and Portugal (2025).
Provisional figures
A provisional value (flag p) may still be revised. This concerns Lithuania (2025).
Sources and data
Eurostat, Overall life satisfaction by sex, age and educational attainment (ilc_pw01). Data updated 20 October 2026, retrieved 2 November 2026. Licence: CC BY 4.0.
Eurostat metadata · Eurostat methodology
https://ec.europa.eu/eurostat/api/dissemination/statistics/1.0/data/ilc_pw01?format=JSON&lang=en&age=Y_GE16&freq=A&geo=AT&geo=BE&geo=BG&geo=CY&geo=CZ&geo=DE&geo=DK&geo=EE&geo=EL&geo=ES&geo=EU27_2020&geo=FI&geo=FR&geo=HR&geo=HU&geo=IE&geo=IT&geo=LT&geo=LU&geo=LV&geo=MT&geo=NL&geo=PL&geo=PT&geo=RO&geo=SE&geo=SI&geo=SK&isced11=TOTAL&life_sat=LIFE&sex=T&statinfo=AVG&unit=RTGRelated stories
-
Risk of poverty or social exclusion
The risk of poverty or social exclusion ranges from 11.5% in Czechia to 29.0% in Bulgaria (2025)
-
Life expectancy at birth
Life expectancy at birth is 8.2 years longer in Spain than in Bulgaria (2024)
-
Who cannot keep their home warm
18.1% of people in Greece cannot afford to keep their home warm, against 2.6% in Finland (2025)
-
Electric cars among new cars
In Denmark, 67.8% of new cars were battery-only electric, against 1.9% in Croatia (2025)