Electric cars among new cars
Topic: Transport
In Denmark, 67.8% of new cars were battery-only electric, against 1.9% in Croatia.
In 2025, 17.3% of the new passenger cars registered in the EU were battery-only electric. Imported second-hand cars are not counted.
- Figures for:
- 2025.
- Covers:
- the whole year.
- New data:
- once a year.
- Dataset updated:
- 6 October 2026.
Published 3 November 2026
The ranking
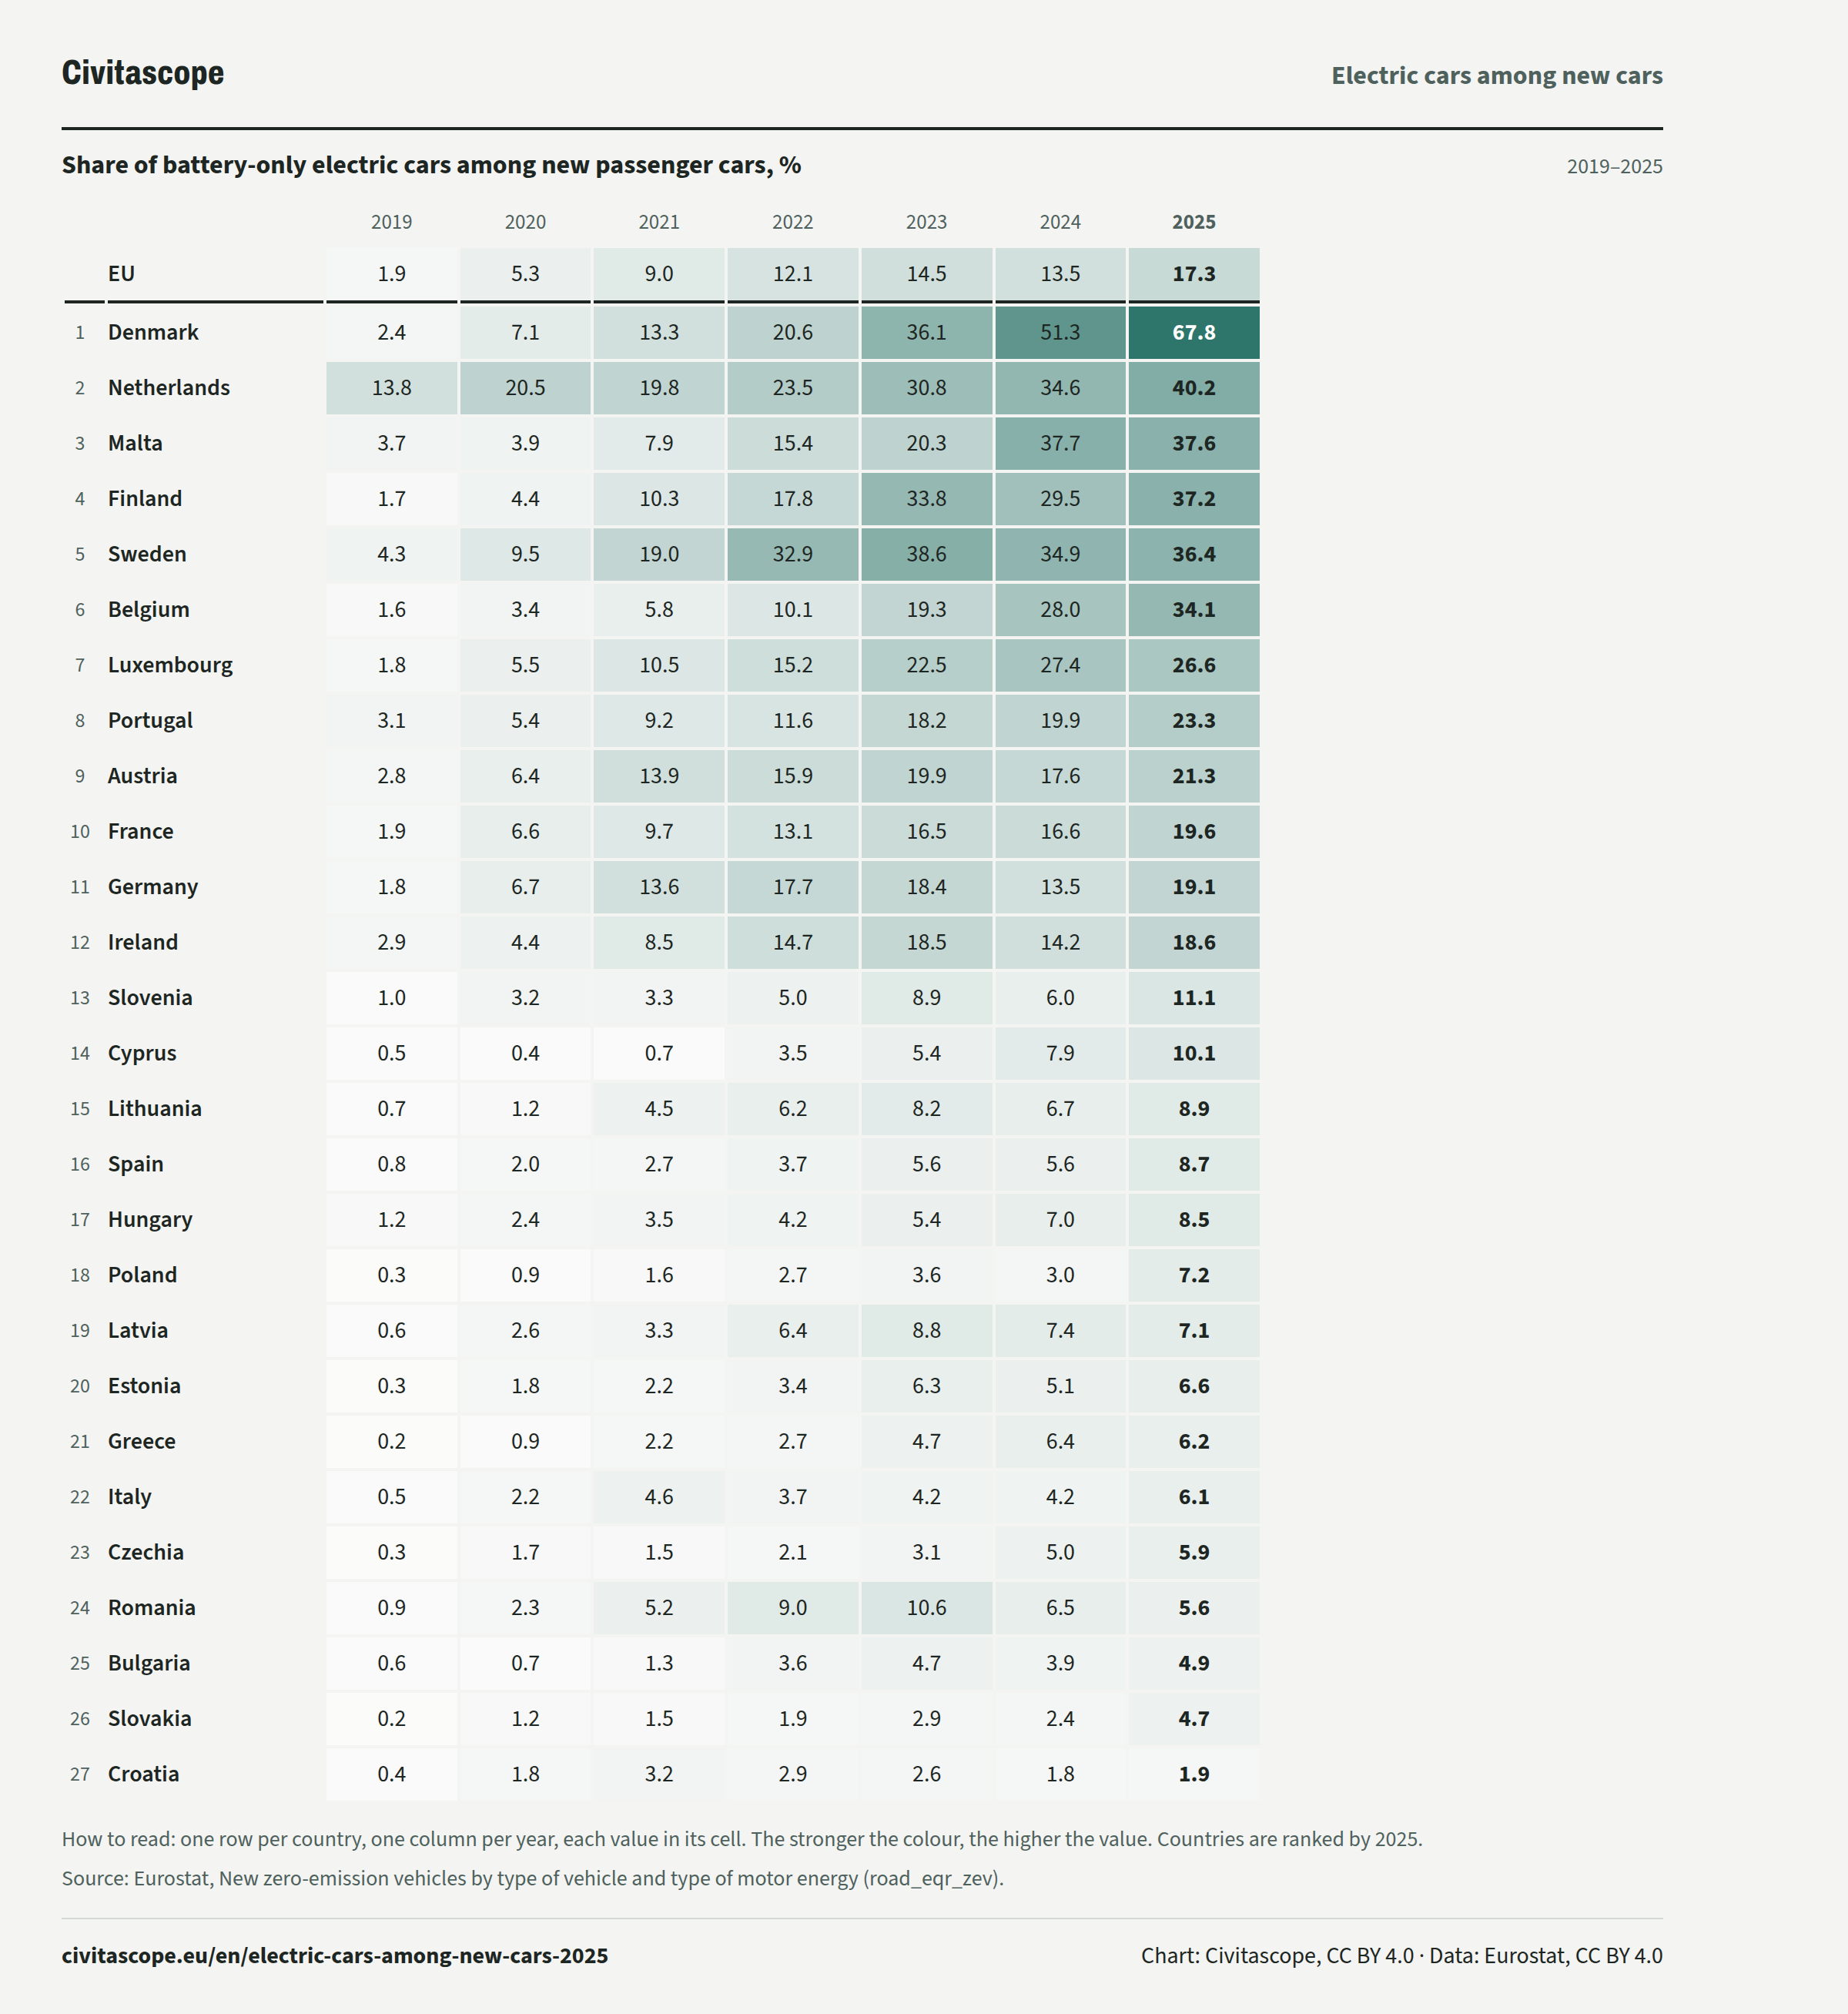
In 2025, the share of battery-only electric cars among new passenger cars was highest in Denmark, at 67.8%, and lowest in Croatia, at 1.9%.
Share of battery-only electric cars among new passenger cars, %
2019–2025| 2019 | 2020 | 2021 | 2022 | 2023 | 2024 | 2025 | ||
|---|---|---|---|---|---|---|---|---|
| EU, | 2019: 1.9 %, | 2020: 5.3 %, | 2021: 9.0 %, | 2022: 12.1 %, | 2023: 14.5 %, | 2024: 13.5 %, | 2025: 17.3 %, | |
| Rank 1: | Denmark, | 2019: 2.4 %, | 2020: 7.1 %, | 2021: 13.3 %, | 2022: 20.6 %, | 2023: 36.1 %, | 2024: 51.3 %, | 2025: 67.8 %, |
| Rank 2: | Netherlands, | 2019: 13.8 %, | 2020: 20.5 %, | 2021: 19.8 %, | 2022: 23.5 %, | 2023: 30.8 %, | 2024: 34.6 %, | 2025: 40.2 %, |
| Rank 3: | Malta, | 2019: 3.7 %, | 2020: 3.9 %, | 2021: 7.9 %, | 2022: 15.4 %, | 2023: 20.3 %, | 2024: 37.7 %, | 2025: 37.6 %, |
| Rank 4: | Finland, | 2019: 1.7 %, | 2020: 4.4 %, | 2021: 10.3 %, | 2022: 17.8 %, | 2023: 33.8 %, | 2024: 29.5 %, | 2025: 37.2 %, |
| Rank 5: | Sweden, | 2019: 4.3 %, | 2020: 9.5 %, | 2021: 19.0 %, | 2022: 32.9 %, | 2023: 38.6 %, | 2024: 34.9 %, | 2025: 36.4 %, |
| Rank 6: | Belgium, | 2019: 1.6 %, | 2020: 3.4 %, | 2021: 5.8 %, | 2022: 10.1 %, | 2023: 19.3 %, | 2024: 28.0 %, | 2025: 34.1 %, |
| Rank 7: | Luxembourg, | 2019: 1.8 %, | 2020: 5.5 %, | 2021: 10.5 %, | 2022: 15.2 %, | 2023: 22.5 %, | 2024: 27.4 %, | 2025: 26.6 %, |
| Rank 8: | Portugal, | 2019: 3.1 %, | 2020: 5.4 %, | 2021: 9.2 %, | 2022: 11.6 %, | 2023: 18.2 %, | 2024: 19.9 %, | 2025: 23.3 %, |
| Rank 9: | Austria, | 2019: 2.8 %, | 2020: 6.4 %, | 2021: 13.9 %, | 2022: 15.9 %, | 2023: 19.9 %, | 2024: 17.6 %, | 2025: 21.3 %, |
| Rank 10: | France, | 2019: 1.9 %, | 2020: 6.6 %, | 2021: 9.7 %, | 2022: 13.1 %, | 2023: 16.5 %, | 2024: 16.6 %, | 2025: 19.6 %, |
| Rank 11: | Germany, | 2019: 1.8 %, | 2020: 6.7 %, | 2021: 13.6 %, | 2022: 17.7 %, | 2023: 18.4 %, | 2024: 13.5 %, | 2025: 19.1 %, |
| Rank 12: | Ireland, | 2019: 2.9 %, | 2020: 4.4 %, | 2021: 8.5 %, | 2022: 14.7 %, | 2023: 18.5 %, | 2024: 14.2 %, | 2025: 18.6 %, |
| Rank 13: | Slovenia, | 2019: 1.0 %, | 2020: 3.2 %, | 2021: 3.3 %, | 2022: 5.0 %, | 2023: 8.9 %, | 2024: 6.0 %, | 2025: 11.1 %, |
| Rank 14: | Cyprus, | 2019: 0.5 %, | 2020: 0.4 %, | 2021: 0.7 %, | 2022: 3.5 %, | 2023: 5.4 %, | 2024: 7.9 %, | 2025: 10.1 %, |
| Rank 15: | Lithuania, | 2019: 0.7 %, | 2020: 1.2 %, | 2021: 4.5 %, | 2022: 6.2 %, | 2023: 8.2 %, | 2024: 6.7 %, | 2025: 8.9 %, |
| Rank 16: | Spain, | 2019: 0.8 %, | 2020: 2.0 %, | 2021: 2.7 %, | 2022: 3.7 %, | 2023: 5.6 %, | 2024: 5.6 %, | 2025: 8.7 %, |
| Rank 17: | Hungary, | 2019: 1.2 %, | 2020: 2.4 %, | 2021: 3.5 %, | 2022: 4.2 %, | 2023: 5.4 %, | 2024: 7.0 %, | 2025: 8.5 %, |
| Rank 18: | Poland, | 2019: 0.3 %, | 2020: 0.9 %, | 2021: 1.6 %, | 2022: 2.7 %, | 2023: 3.6 %, | 2024: 3.0 %, | 2025: 7.2 %, |
| Rank 19: | Latvia, | 2019: 0.6 %, | 2020: 2.6 %, | 2021: 3.3 %, | 2022: 6.4 %, | 2023: 8.8 %, | 2024: 7.4 %, | 2025: 7.1 %, |
| Rank 20: | Estonia, | 2019: 0.3 %, | 2020: 1.8 %, | 2021: 2.2 %, | 2022: 3.4 %, | 2023: 6.3 %, | 2024: 5.1 %, | 2025: 6.6 %, |
| Rank 21: | Greece, | 2019: 0.2 %, | 2020: 0.9 %, | 2021: 2.2 %, | 2022: 2.7 %, | 2023: 4.7 %, | 2024: 6.4 %, | 2025: 6.2 %, |
| Rank 22: | Italy, | 2019: 0.5 %, | 2020: 2.2 %, | 2021: 4.6 %, | 2022: 3.7 %, | 2023: 4.2 %, | 2024: 4.2 %, | 2025: 6.1 %, |
| Rank 23: | Czechia, | 2019: 0.3 %, | 2020: 1.7 %, | 2021: 1.5 %, | 2022: 2.1 %, | 2023: 3.1 %, | 2024: 5.0 %, | 2025: 5.9 %, |
| Rank 24: | Romania, | 2019: 0.9 %, | 2020: 2.3 %, | 2021: 5.2 %, | 2022: 9.0 %, | 2023: 10.6 %, | 2024: 6.5 %, | 2025: 5.6 %, |
| Rank 25: | Bulgaria, | 2019: 0.6 %, | 2020: 0.7 %, | 2021: 1.3 %, | 2022: 3.6 %, | 2023: 4.7 %, | 2024: 3.9 %, | 2025: 4.9 %, |
| Rank 26: | Slovakia, | 2019: 0.2 %, | 2020: 1.2 %, | 2021: 1.5 %, | 2022: 1.9 %, | 2023: 2.9 %, | 2024: 2.4 %, | 2025: 4.7 %, |
| Rank 27: | Croatia, | 2019: 0.4 %, | 2020: 1.8 %, | 2021: 3.2 %, | 2022: 2.9 %, | 2023: 2.6 %, | 2024: 1.8 %, | 2025: 1.9 %, |
New cars and all cars in use
Among all passenger cars in use at the end of the year, the share was highest in Denmark, at 17.93%, and lowest in Poland, at 0.44%.
Share of battery-only electric cars among new cars and among all cars in use, %
2025(%)
| Among new cars | Among all cars in use | |
|---|---|---|
| Lowest | 1.9%Croatia | 0.44%Poland |
| Highest | 67.8%Denmark | 17.93%Denmark |
| Highest − lowest | 65.9 pp | 17.49 pp |
About the data
Battery-only electric passenger cars as a percentage of all passenger cars registered for the first time in the year, excluding imported second-hand cars.
Eurostat: “New vehicles registered during the year are those vehicles that are registered for the first time, irrespective of the country of registration. Imported second-hand vehicles are excluded.” (source)
The Common Questionnaire for Inland Transport Statistics of Eurostat, the UNECE and the International Transport Forum, filled in voluntarily by national authorities from vehicle registers. Some gaps are filled by Eurostat with data from the European Alternative Fuels Observatory, the car manufacturers' association (ACEA) or other public sources.
How to read these numbers
How it is measured
Eurostat's percentages carry no flags of their own. The counts they are computed from do. In 2025 the counts of new battery-only electric cars were imputed by Eurostat for Bulgaria, Greece, Hungary, Ireland, Poland and Slovakia, and the counts of all new cars for Hungary and Ireland. Portugal's counts are provisional, and Slovenia's have a break in the series. In earlier years Eurostat imputed the counts of new battery-only electric cars for Bulgaria, Poland and Slovakia every year since 2013, and imputed or estimated them for some other countries in some years.
Some national gaps are filled by Eurostat with data from the European Alternative Fuels Observatory, the car manufacturers' association (ACEA) or other public sources such as national statistical institutes' websites.
Countries report these data voluntarily. They use common definitions but collect the data in different ways.
Eurostat publishes each year's figures in two steps. The July release is completed by early estimates, and definitive figures follow in mid-December of the year after the reference year. The figures for 2025 may still change until mid-December 2026.
Eurostat's percentages carry no flags of their own. The counts they are computed from do. In 2025 the counts of battery-only electric cars were imputed by Eurostat for Bulgaria, France, Greece, Ireland, the Netherlands, Poland and Slovakia, and the counts of all cars for France, Ireland and Poland. Portugal's counts are provisional, and Slovenia's have a break in the series. In earlier years Eurostat imputed the counts of battery-only electric cars for Bulgaria, Greece and Slovakia almost every year since 2013, and for some other countries in some years.
Countries report these data voluntarily. They use common definitions but collect the data in different ways. Vehicle registers can include very old cars that are no longer on the road.
Breaks in the series
From 2025 the passenger cars include special purpose vehicles in the same category. Eurostat calls this a break in the series between 2024 and 2025.
Sources and data
Eurostat, New zero-emission vehicles by type of vehicle and type of motor energy (road_eqr_zev). Data updated 6 October 2026, retrieved 3 November 2026. Licence: CC BY 4.0.
Eurostat metadata · Eurostat methodology
https://ec.europa.eu/eurostat/api/dissemination/statistics/1.0/data/road_eqr_zev?format=JSON&lang=en&freq=A&geo=AT&geo=BE&geo=BG&geo=CY&geo=CZ&geo=DE&geo=DK&geo=EE&geo=EL&geo=ES&geo=EU27_2020&geo=FI&geo=FR&geo=HR&geo=HU&geo=IE&geo=IT&geo=LT&geo=LU&geo=LV&geo=MT&geo=NL&geo=PL&geo=PT&geo=RO&geo=SE&geo=SI&geo=SK&mot_nrg=ELC&unit=PC&vehicle=CAREurostat, Stock of zero-emission vehicles at 31st December by type of vehicle and type of motor energy (road_eqs_zev). Data updated 6 October 2026, retrieved 3 November 2026. Licence: CC BY 4.0.
https://ec.europa.eu/eurostat/api/dissemination/statistics/1.0/data/road_eqs_zev?format=JSON&lang=en&freq=A&geo=AT&geo=BE&geo=BG&geo=CY&geo=CZ&geo=DE&geo=DK&geo=EE&geo=EL&geo=ES&geo=EU27_2020&geo=FI&geo=FR&geo=HR&geo=HU&geo=IE&geo=IT&geo=LT&geo=LU&geo=LV&geo=MT&geo=NL&geo=PL&geo=PT&geo=RO&geo=SE&geo=SI&geo=SK&mot_nrg=ELC&unit=PC&vehicle=CARRelated stories
-
Cars per 1,000 inhabitants
Italy has 1.6 times as many cars per inhabitant as Latvia (2025)
-
Who has never been online
In Croatia, 10.33% of people aged 16 to 74 have never used the internet, against 0.20% in Ireland (2025)
-
Who uses generative AI in the EU
In Denmark, the share of people using generative AI is 30.6 percentage points higher than in Romania (2025)
-
How satisfied people are with their lives
In Finland and Romania, people rate their life 7.8 out of 10 on average, against 6.3 out of 10 in Bulgaria (2025)