Overcrowded homes
Topic: Housing
40.4% of people in Romania live in an overcrowded home, against 2.2% in Cyprus.
In 2025, 16.8% of people in the EU lived in an overcrowded home. A home is overcrowded when it has fewer rooms than the household's size and make-up need.
- Figures for:
- 2025.
- Covers:
- the time of the survey.
- New data:
- once a year.
- Dataset updated:
- 20 October 2026.
The ranking
In 2025, the share of people living in an overcrowded home ranged from 2.2% in Cyprus to 40.4% in Romania.
Share of people living in an overcrowded home, %
2025Poverty risk and crowded homes
Among people not at risk of poverty, the gap was narrower. It ranged from 1.2% in Cyprus to 37.9% in Latvia. The gap was 36.7 percentage points.
Among people at risk of poverty, the gap was wider. It ranged from 7.6% in Cyprus to 52.6% in Romania. The gap was 45.0 percentage points.
Share of people living in an overcrowded home: not at risk of poverty and at risk of poverty
2025| Everyone | Not at risk of poverty | At risk of poverty | |
|---|---|---|---|
| Lowest | 2.2%Cyprus | 1.2%Cyprus | 7.6%Cyprus |
| Highest | 40.4%Romania | 37.9%Latvia | 52.6%Romania |
| Highest − lowest | 38.2 pp | 36.7 pp | 45.0 pp |
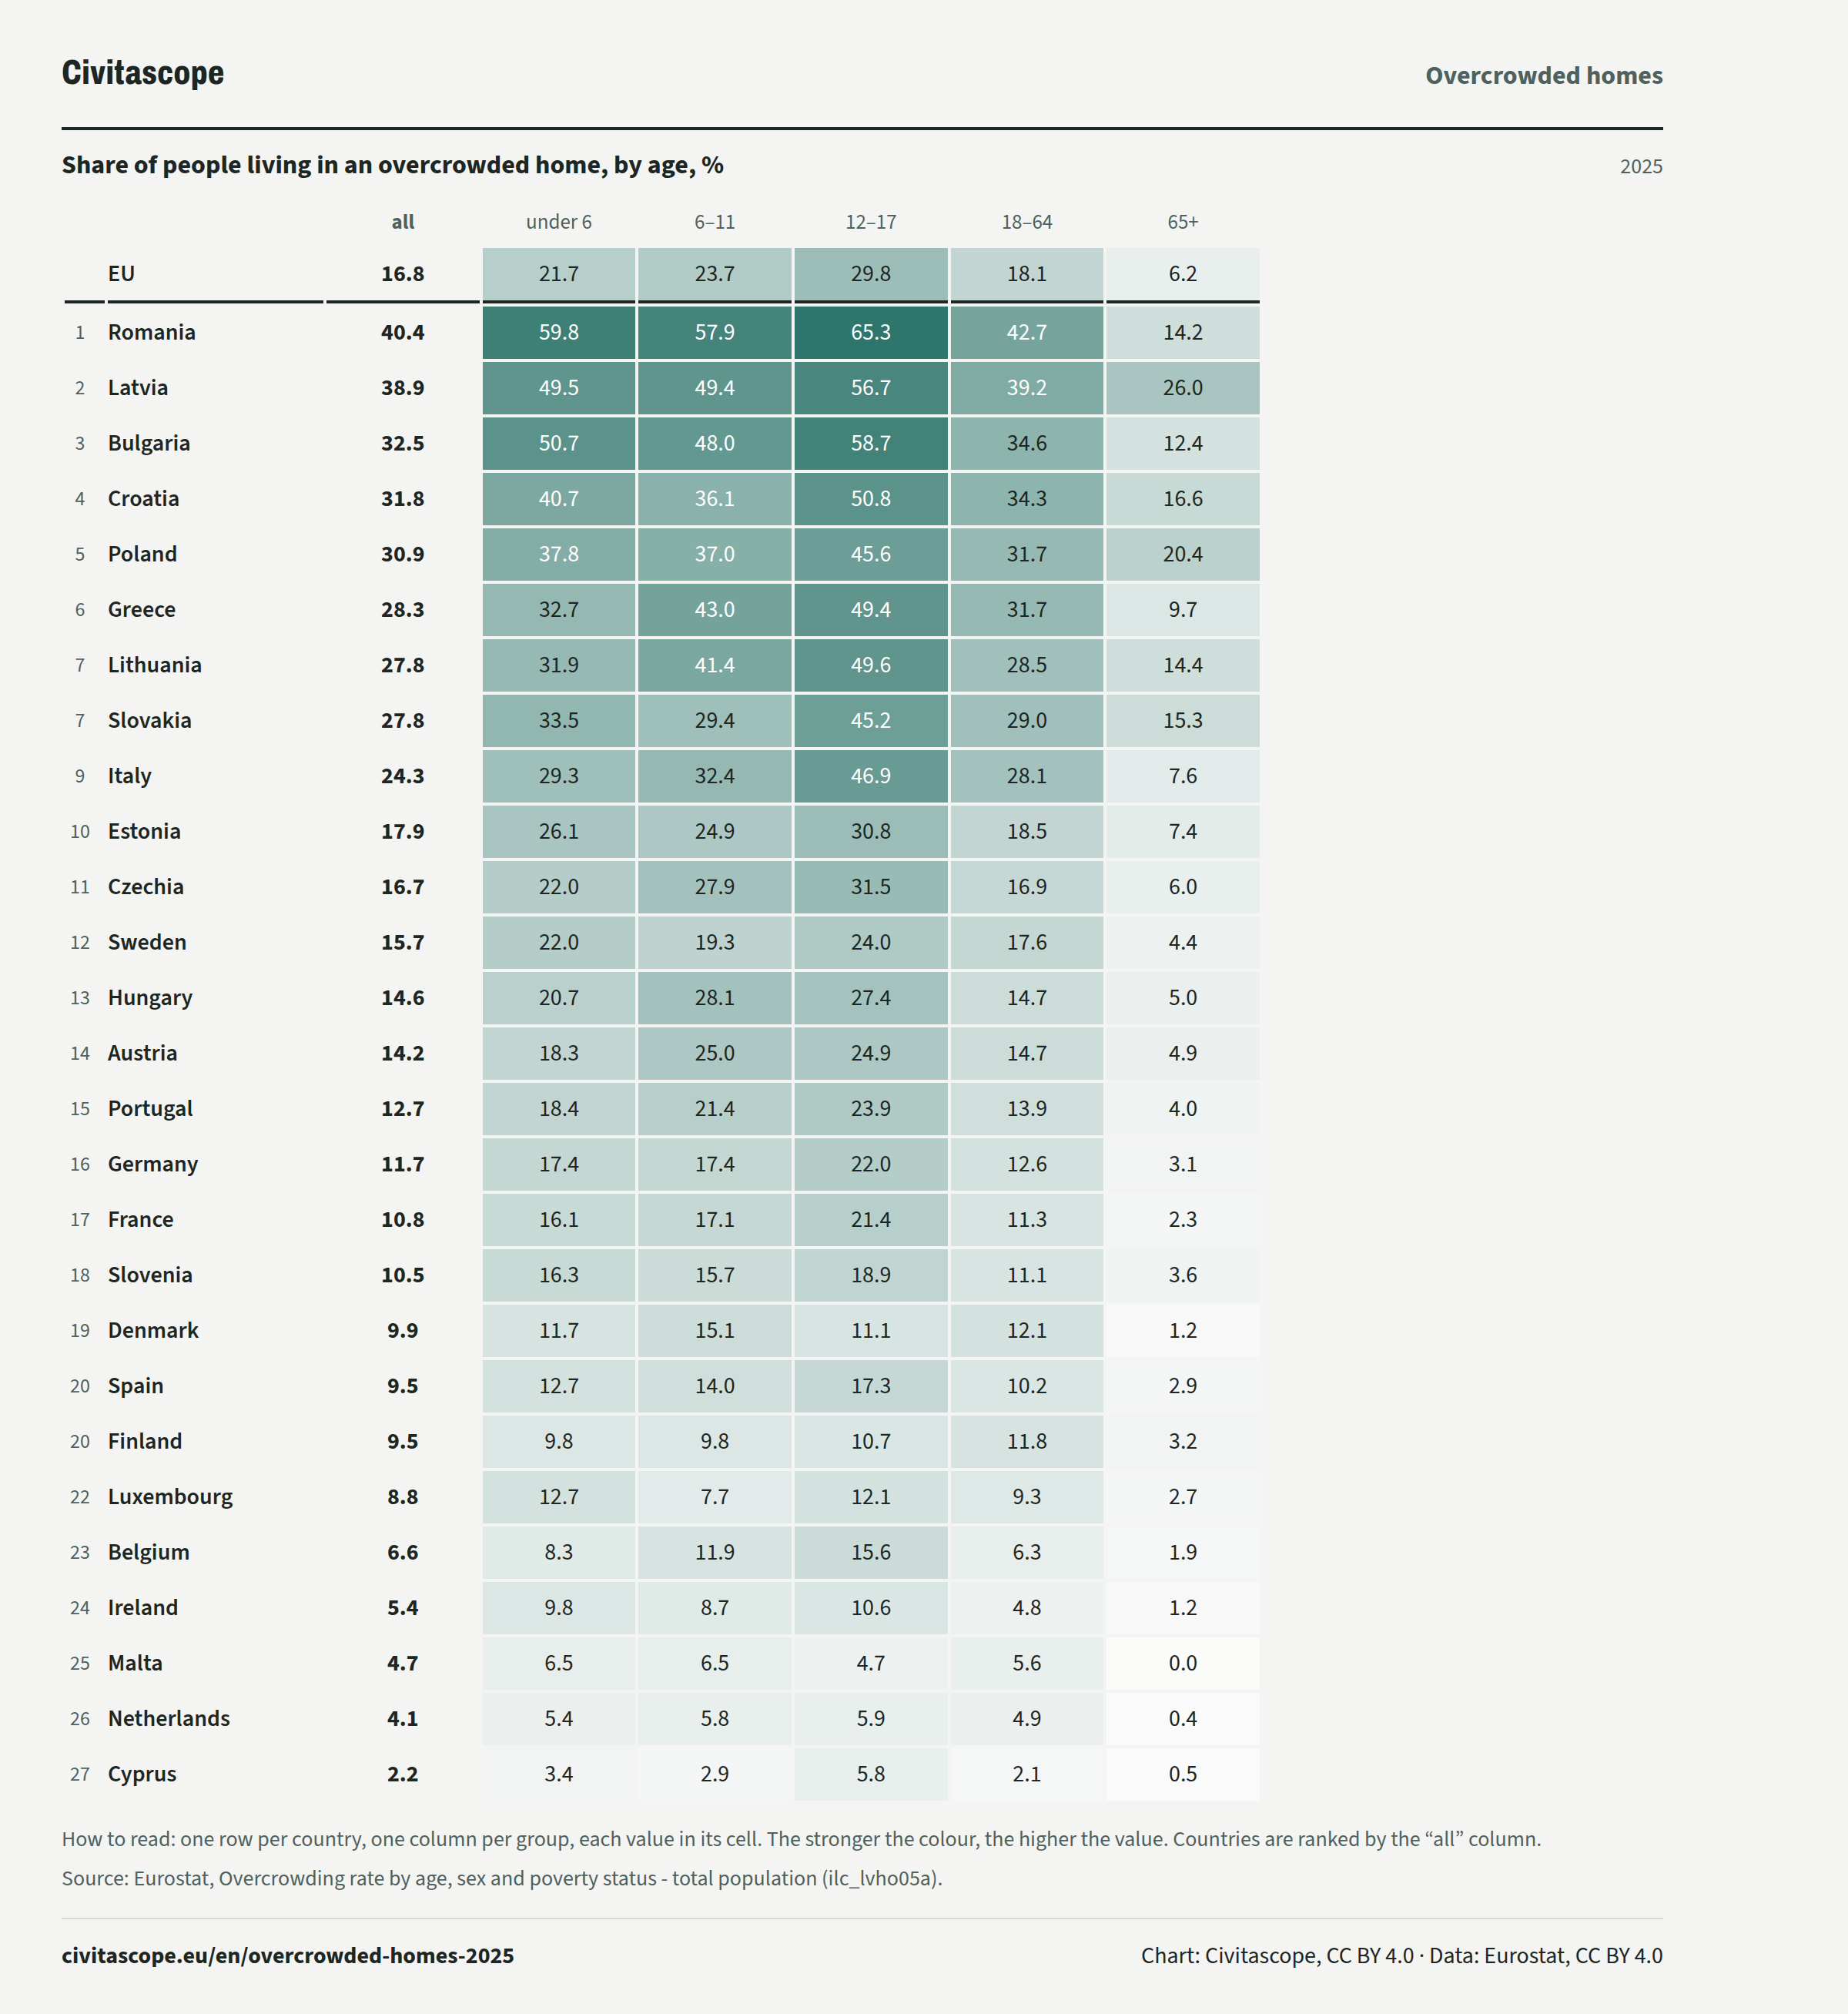
Children and older people
In the EU, 29.8% of people aged 12 to 17 lived in an overcrowded home, against 6.2% of people aged 65 or over.
Share of people living in an overcrowded home, by age, %
2025| all | under 6 | 6–11 | 12–17 | 18–64 | 65+ | ||
|---|---|---|---|---|---|---|---|
| EU, | all: 16.8 %, | under 6: 21.7 %, | 6–11: 23.7 %, | 12–17: 29.8 %, | 18–64: 18.1 %, | 65+: 6.2 %, | |
| Rank 1: | Romania, | all: 40.4 %, | under 6: 59.8 %, | 6–11: 57.9 %, | 12–17: 65.3 %, | 18–64: 42.7 %, | 65+: 14.2 %, |
| Rank 2: | Latvia, | all: 38.9 %, | under 6: 49.5 %, | 6–11: 49.4 %, | 12–17: 56.7 %, | 18–64: 39.2 %, | 65+: 26.0 %, |
| Rank 3: | Bulgaria, | all: 32.5 %, | under 6: 50.7 %, | 6–11: 48.0 %, | 12–17: 58.7 %, | 18–64: 34.6 %, | 65+: 12.4 %, |
| Rank 4: | Croatia, | all: 31.8 %, | under 6: 40.7 %, | 6–11: 36.1 %, | 12–17: 50.8 %, | 18–64: 34.3 %, | 65+: 16.6 %, |
| Rank 5: | Poland, | all: 30.9 %, | under 6: 37.8 %, | 6–11: 37.0 %, | 12–17: 45.6 %, | 18–64: 31.7 %, | 65+: 20.4 %, |
| Rank 6: | Greece, | all: 28.3 %, | under 6: 32.7 %, | 6–11: 43.0 %, | 12–17: 49.4 %, | 18–64: 31.7 %, | 65+: 9.7 %, |
| Rank 7: | Lithuania, | all: 27.8 %, | under 6: 31.9 %, | 6–11: 41.4 %, | 12–17: 49.6 %, | 18–64: 28.5 %, | 65+: 14.4 %, |
| Rank 7: | Slovakia, | all: 27.8 %, | under 6: 33.5 %, | 6–11: 29.4 %, | 12–17: 45.2 %, | 18–64: 29.0 %, | 65+: 15.3 %, |
| Rank 9: | Italy, | all: 24.3 %, | under 6: 29.3 %, | 6–11: 32.4 %, | 12–17: 46.9 %, | 18–64: 28.1 %, | 65+: 7.6 %, |
| Rank 10: | Estonia, | all: 17.9 %, | under 6: 26.1 %, | 6–11: 24.9 %, | 12–17: 30.8 %, | 18–64: 18.5 %, | 65+: 7.4 %, |
| Rank 11: | Czechia, | all: 16.7 %, | under 6: 22.0 %, | 6–11: 27.9 %, | 12–17: 31.5 %, | 18–64: 16.9 %, | 65+: 6.0 %, |
| Rank 12: | Sweden, | all: 15.7 %, | under 6: 22.0 %, | 6–11: 19.3 %, | 12–17: 24.0 %, | 18–64: 17.6 %, | 65+: 4.4 %, |
| Rank 13: | Hungary, | all: 14.6 %, | under 6: 20.7 %, | 6–11: 28.1 %, | 12–17: 27.4 %, | 18–64: 14.7 %, | 65+: 5.0 %, |
| Rank 14: | Austria, | all: 14.2 %, | under 6: 18.3 %, | 6–11: 25.0 %, | 12–17: 24.9 %, | 18–64: 14.7 %, | 65+: 4.9 %, |
| Rank 15: | Portugal, | all: 12.7 %, | under 6: 18.4 %, | 6–11: 21.4 %, | 12–17: 23.9 %, | 18–64: 13.9 %, | 65+: 4.0 %, |
| Rank 16: | Germany, | all: 11.7 %, | under 6: 17.4 %, | 6–11: 17.4 %, | 12–17: 22.0 %, | 18–64: 12.6 %, | 65+: 3.1 %, |
| Rank 17: | France, | all: 10.8 %, | under 6: 16.1 %, | 6–11: 17.1 %, | 12–17: 21.4 %, | 18–64: 11.3 %, | 65+: 2.3 %, |
| Rank 18: | Slovenia, | all: 10.5 %, | under 6: 16.3 %, | 6–11: 15.7 %, | 12–17: 18.9 %, | 18–64: 11.1 %, | 65+: 3.6 %, |
| Rank 19: | Denmark, | all: 9.9 %, | under 6: 11.7 %, | 6–11: 15.1 %, | 12–17: 11.1 %, | 18–64: 12.1 %, | 65+: 1.2 %, |
| Rank 20: | Spain, | all: 9.5 %, | under 6: 12.7 %, | 6–11: 14.0 %, | 12–17: 17.3 %, | 18–64: 10.2 %, | 65+: 2.9 %, |
| Rank 20: | Finland, | all: 9.5 %, | under 6: 9.8 %, | 6–11: 9.8 %, | 12–17: 10.7 %, | 18–64: 11.8 %, | 65+: 3.2 %, |
| Rank 22: | Luxembourg, | all: 8.8 %, | under 6: 12.7 %, | 6–11: 7.7 %, | 12–17: 12.1 %, | 18–64: 9.3 %, | 65+: 2.7 %, |
| Rank 23: | Belgium, | all: 6.6 %, | under 6: 8.3 %, | 6–11: 11.9 %, | 12–17: 15.6 %, | 18–64: 6.3 %, | 65+: 1.9 %, |
| Rank 24: | Ireland, | all: 5.4 %, | under 6: 9.8 %, | 6–11: 8.7 %, | 12–17: 10.6 %, | 18–64: 4.8 %, | 65+: 1.2 %, |
| Rank 25: | Malta, | all: 4.7 %, | under 6: 6.5 %, | 6–11: 6.5 %, | 12–17: 4.7 %, | 18–64: 5.6 %, | 65+: 0.0 %, |
| Rank 26: | Netherlands, | all: 4.1 %, | under 6: 5.4 %, | 6–11: 5.8 %, | 12–17: 5.9 %, | 18–64: 4.9 %, | 65+: 0.4 %, |
| Rank 27: | Cyprus, | all: 2.2 %, | under 6: 3.4 %, | 6–11: 2.9 %, | 12–17: 5.8 %, | 18–64: 2.1 %, | 65+: 0.5 %, |
About the data
The share of people living in an overcrowded household. A household is overcrowded when it has fewer rooms than the minimum for its size and make-up. That minimum is one room for the household, one per couple and one per single person aged 18 or more. Two young people aged 12 to 17 of the same sex share a room, otherwise each has one. Two children under 12 share a room. Kitchens count as rooms, but bathrooms, toilets and passageways do not. A room must be at least 4 square metres.
Eurostat: “The overcrowding rate is defined as the percentage of the population living in an overcrowded household. A person is considered as living in an overcrowded household if the household does not have at its disposal a minimum number of rooms equal to:” (source)
EU statistics on income and living conditions (EU-SILC): a yearly sample survey of households, run by the national statistical institutes.
How to read these numbers
How it is measured
The survey covers people living in private households. People in collective households and institutions are generally not included (Estonia includes collective households).
Provisional figures
Some 2025 values are provisional (flag p) and may be revised.
Sources and data
Eurostat, Overcrowding rate by age, sex and poverty status - total population (ilc_lvho05a). Data updated 20 October 2026, retrieved 29 October 2026. Licence: CC BY 4.0.
Eurostat metadata · Eurostat methodology
https://ec.europa.eu/eurostat/api/dissemination/statistics/1.0/data/ilc_lvho05a?format=JSON&lang=en&age=TOTAL&freq=A&geo=AT&geo=BE&geo=BG&geo=CY&geo=CZ&geo=DE&geo=DK&geo=EE&geo=EL&geo=ES&geo=EU27_2020&geo=FI&geo=FR&geo=HR&geo=HU&geo=IE&geo=IT&geo=LT&geo=LU&geo=LV&geo=MT&geo=NL&geo=PL&geo=PT&geo=RO&geo=SE&geo=SI&geo=SK&rskpovth=TOTAL&sex=T&unit=PC