Shopping online
Topic: Digital technology
95.1% of people aged 16 to 74 in Ireland bought something online in a year, against 51.2% in Bulgaria.
In 2025, 73.6% of people aged 16 to 74 in the EU bought or ordered goods or services online for private use in the twelve months before the survey. People say this themselves in a survey.
- Figures for:
- 2025.
- Covers:
- differs by country.
- New data:
- once a year.
- Dataset updated:
- 17 April 2026.
Published 4 November 2026
The ranking
In 2025, the share of people aged 16 to 74 who bought something online ranged from 51.2% in Bulgaria to 95.1% in Ireland.
Share of people aged 16 to 74 who bought something online, %
2025 · people aged 16 to 74Over time
Share of people aged 16 to 74 who bought something online in the EU, %
2021–2025 · people aged 16 to 74Between 2021 and 2025, the share fell in 2 countries and rose in 25.
Share of people aged 16 to 74 who bought something online, %
2021 and 2025 · ranked by 2025 · people aged 16 to 74How often
In 2025, 21.31% of people aged 16 to 74 in the EU bought online once or twice in the three months before the survey, and 9.54% more than ten times.
People aged 16 to 74 who bought online in the three months before the survey, by number of purchases, % of all people aged 16 to 74
2025Young and old
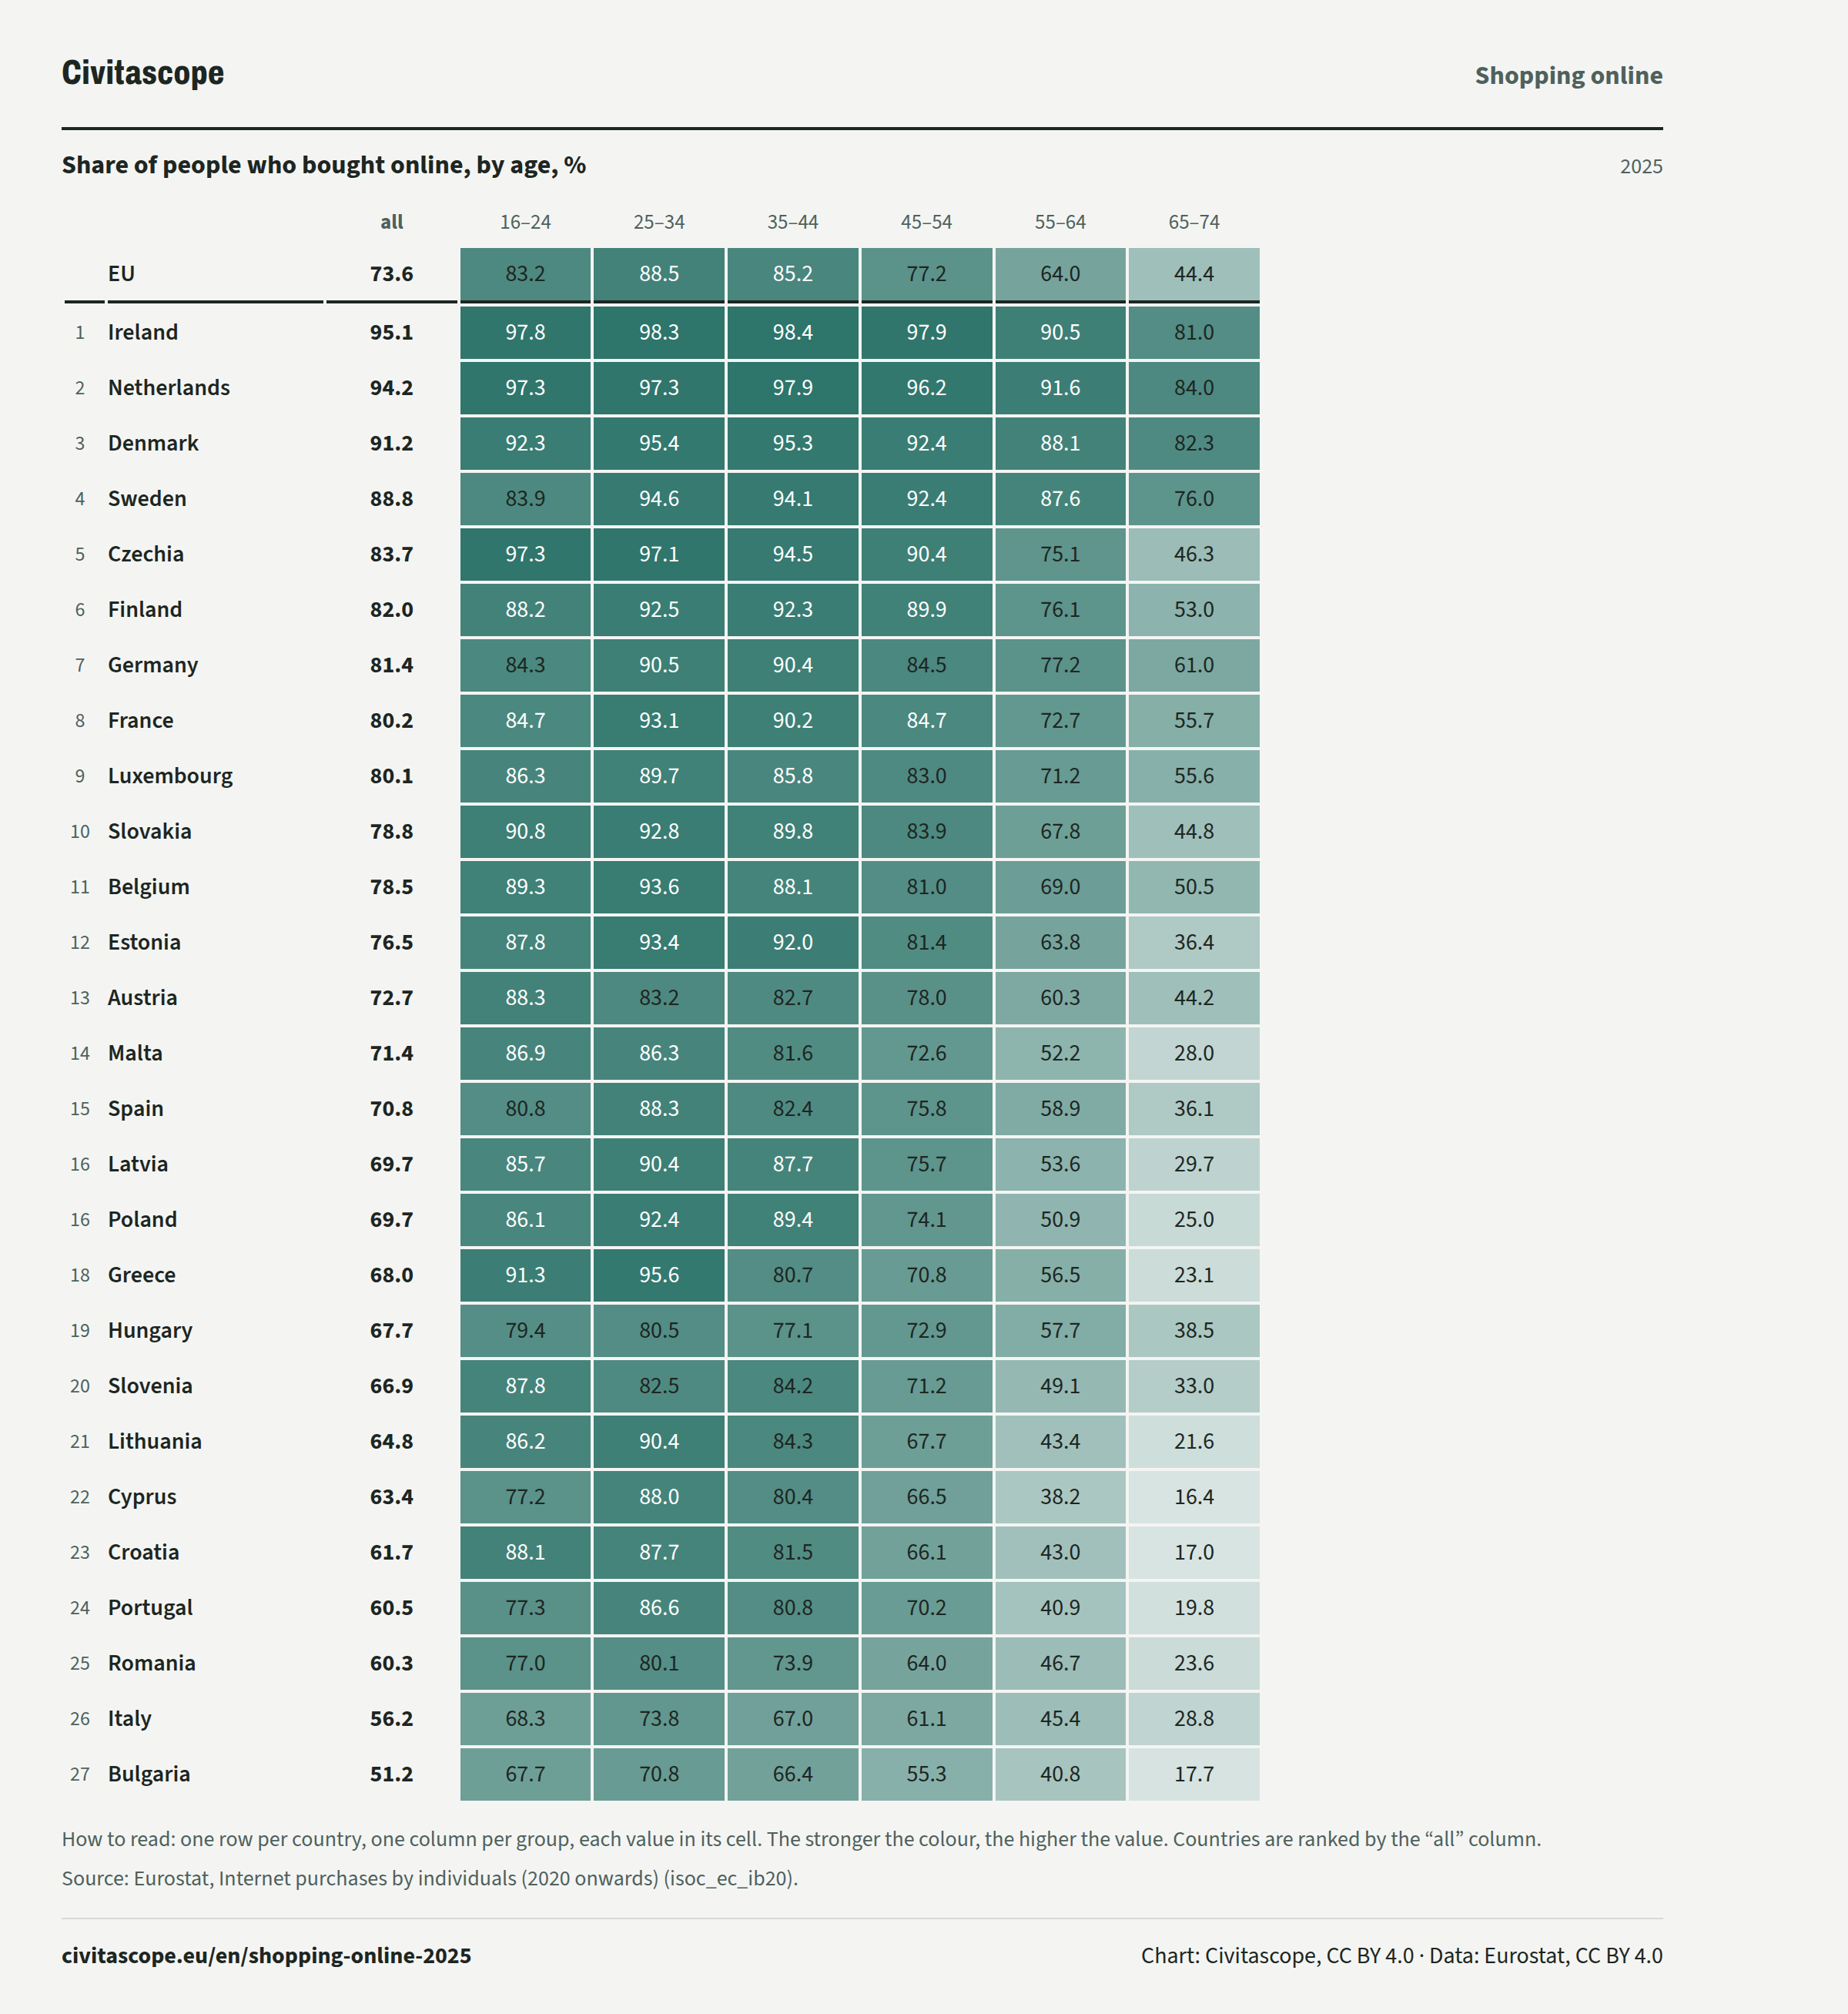
In 2025, 88.5% of people aged 25 to 34 in the EU bought online, against 44.4% of people aged 65 to 74.
Share of people who bought online, by age, %
2025| all | 16–24 | 25–34 | 35–44 | 45–54 | 55–64 | 65–74 | ||
|---|---|---|---|---|---|---|---|---|
| EU, | all: 73.6 %, | 16–24: 83.2 %, | 25–34: 88.5 %, | 35–44: 85.2 %, | 45–54: 77.2 %, | 55–64: 64.0 %, | 65–74: 44.4 %, | |
| Rank 1: | Ireland, | all: 95.1 %, | 16–24: 97.8 %, | 25–34: 98.3 %, | 35–44: 98.4 %, | 45–54: 97.9 %, | 55–64: 90.5 %, | 65–74: 81.0 %, |
| Rank 2: | Netherlands, | all: 94.2 %, | 16–24: 97.3 %, | 25–34: 97.3 %, | 35–44: 97.9 %, | 45–54: 96.2 %, | 55–64: 91.6 %, | 65–74: 84.0 %, |
| Rank 3: | Denmark, | all: 91.2 %, | 16–24: 92.3 %, | 25–34: 95.4 %, | 35–44: 95.3 %, | 45–54: 92.4 %, | 55–64: 88.1 %, | 65–74: 82.3 %, |
| Rank 4: | Sweden, | all: 88.8 %, | 16–24: 83.9 %, | 25–34: 94.6 %, | 35–44: 94.1 %, | 45–54: 92.4 %, | 55–64: 87.6 %, | 65–74: 76.0 %, |
| Rank 5: | Czechia, | all: 83.7 %, | 16–24: 97.3 %, | 25–34: 97.1 %, | 35–44: 94.5 %, | 45–54: 90.4 %, | 55–64: 75.1 %, | 65–74: 46.3 %, |
| Rank 6: | Finland, | all: 82.0 %, | 16–24: 88.2 %, | 25–34: 92.5 %, | 35–44: 92.3 %, | 45–54: 89.9 %, | 55–64: 76.1 %, | 65–74: 53.0 %, |
| Rank 7: | Germany, | all: 81.4 %, | 16–24: 84.3 %, | 25–34: 90.5 %, | 35–44: 90.4 %, | 45–54: 84.5 %, | 55–64: 77.2 %, | 65–74: 61.0 %, |
| Rank 8: | France, | all: 80.2 %, | 16–24: 84.7 %, | 25–34: 93.1 %, | 35–44: 90.2 %, | 45–54: 84.7 %, | 55–64: 72.7 %, | 65–74: 55.7 %, |
| Rank 9: | Luxembourg, | all: 80.1 %, | 16–24: 86.3 %, | 25–34: 89.7 %, | 35–44: 85.8 %, | 45–54: 83.0 %, | 55–64: 71.2 %, | 65–74: 55.6 %, |
| Rank 10: | Slovakia, | all: 78.8 %, | 16–24: 90.8 %, | 25–34: 92.8 %, | 35–44: 89.8 %, | 45–54: 83.9 %, | 55–64: 67.8 %, | 65–74: 44.8 %, |
| Rank 11: | Belgium, | all: 78.5 %, | 16–24: 89.3 %, | 25–34: 93.6 %, | 35–44: 88.1 %, | 45–54: 81.0 %, | 55–64: 69.0 %, | 65–74: 50.5 %, |
| Rank 12: | Estonia, | all: 76.5 %, | 16–24: 87.8 %, | 25–34: 93.4 %, | 35–44: 92.0 %, | 45–54: 81.4 %, | 55–64: 63.8 %, | 65–74: 36.4 %, |
| Rank 13: | Austria, | all: 72.7 %, | 16–24: 88.3 %, | 25–34: 83.2 %, | 35–44: 82.7 %, | 45–54: 78.0 %, | 55–64: 60.3 %, | 65–74: 44.2 %, |
| Rank 14: | Malta, | all: 71.4 %, | 16–24: 86.9 %, | 25–34: 86.3 %, | 35–44: 81.6 %, | 45–54: 72.6 %, | 55–64: 52.2 %, | 65–74: 28.0 %, |
| Rank 15: | Spain, | all: 70.8 %, | 16–24: 80.8 %, | 25–34: 88.3 %, | 35–44: 82.4 %, | 45–54: 75.8 %, | 55–64: 58.9 %, | 65–74: 36.1 %, |
| Rank 16: | Latvia, | all: 69.7 %, | 16–24: 85.7 %, | 25–34: 90.4 %, | 35–44: 87.7 %, | 45–54: 75.7 %, | 55–64: 53.6 %, | 65–74: 29.7 %, |
| Rank 16: | Poland, | all: 69.7 %, | 16–24: 86.1 %, | 25–34: 92.4 %, | 35–44: 89.4 %, | 45–54: 74.1 %, | 55–64: 50.9 %, | 65–74: 25.0 %, |
| Rank 18: | Greece, | all: 68.0 %, | 16–24: 91.3 %, | 25–34: 95.6 %, | 35–44: 80.7 %, | 45–54: 70.8 %, | 55–64: 56.5 %, | 65–74: 23.1 %, |
| Rank 19: | Hungary, | all: 67.7 %, | 16–24: 79.4 %, | 25–34: 80.5 %, | 35–44: 77.1 %, | 45–54: 72.9 %, | 55–64: 57.7 %, | 65–74: 38.5 %, |
| Rank 20: | Slovenia, | all: 66.9 %, | 16–24: 87.8 %, | 25–34: 82.5 %, | 35–44: 84.2 %, | 45–54: 71.2 %, | 55–64: 49.1 %, | 65–74: 33.0 %, |
| Rank 21: | Lithuania, | all: 64.8 %, | 16–24: 86.2 %, | 25–34: 90.4 %, | 35–44: 84.3 %, | 45–54: 67.7 %, | 55–64: 43.4 %, | 65–74: 21.6 %, |
| Rank 22: | Cyprus, | all: 63.4 %, | 16–24: 77.2 %, | 25–34: 88.0 %, | 35–44: 80.4 %, | 45–54: 66.5 %, | 55–64: 38.2 %, | 65–74: 16.4 %, |
| Rank 23: | Croatia, | all: 61.7 %, | 16–24: 88.1 %, | 25–34: 87.7 %, | 35–44: 81.5 %, | 45–54: 66.1 %, | 55–64: 43.0 %, | 65–74: 17.0 %, |
| Rank 24: | Portugal, | all: 60.5 %, | 16–24: 77.3 %, | 25–34: 86.6 %, | 35–44: 80.8 %, | 45–54: 70.2 %, | 55–64: 40.9 %, | 65–74: 19.8 %, |
| Rank 25: | Romania, | all: 60.3 %, | 16–24: 77.0 %, | 25–34: 80.1 %, | 35–44: 73.9 %, | 45–54: 64.0 %, | 55–64: 46.7 %, | 65–74: 23.6 %, |
| Rank 26: | Italy, | all: 56.2 %, | 16–24: 68.3 %, | 25–34: 73.8 %, | 35–44: 67.0 %, | 45–54: 61.1 %, | 55–64: 45.4 %, | 65–74: 28.8 %, |
| Rank 27: | Bulgaria, | all: 51.2 %, | 16–24: 67.7 %, | 25–34: 70.8 %, | 35–44: 66.4 %, | 45–54: 55.3 %, | 55–64: 40.8 %, | 65–74: 17.7 %, |
| all | 16–24 | 25–34 | 35–44 | ||
|---|---|---|---|---|---|
| EU, | all: 73.6 %, | 16–24: 83.2 %, | 25–34: 88.5 %, | 35–44: 85.2 %, | |
| Rank 1: | Ireland, | all: 95.1 %, | 16–24: 97.8 %, | 25–34: 98.3 %, | 35–44: 98.4 %, |
| Rank 2: | Netherlands, | all: 94.2 %, | 16–24: 97.3 %, | 25–34: 97.3 %, | 35–44: 97.9 %, |
| Rank 3: | Denmark, | all: 91.2 %, | 16–24: 92.3 %, | 25–34: 95.4 %, | 35–44: 95.3 %, |
| Rank 4: | Sweden, | all: 88.8 %, | 16–24: 83.9 %, | 25–34: 94.6 %, | 35–44: 94.1 %, |
| Rank 5: | Czechia, | all: 83.7 %, | 16–24: 97.3 %, | 25–34: 97.1 %, | 35–44: 94.5 %, |
| Rank 6: | Finland, | all: 82.0 %, | 16–24: 88.2 %, | 25–34: 92.5 %, | 35–44: 92.3 %, |
| Rank 7: | Germany, | all: 81.4 %, | 16–24: 84.3 %, | 25–34: 90.5 %, | 35–44: 90.4 %, |
| Rank 8: | France, | all: 80.2 %, | 16–24: 84.7 %, | 25–34: 93.1 %, | 35–44: 90.2 %, |
| Rank 9: | Luxembourg, | all: 80.1 %, | 16–24: 86.3 %, | 25–34: 89.7 %, | 35–44: 85.8 %, |
| Rank 10: | Slovakia, | all: 78.8 %, | 16–24: 90.8 %, | 25–34: 92.8 %, | 35–44: 89.8 %, |
| Rank 11: | Belgium, | all: 78.5 %, | 16–24: 89.3 %, | 25–34: 93.6 %, | 35–44: 88.1 %, |
| Rank 12: | Estonia, | all: 76.5 %, | 16–24: 87.8 %, | 25–34: 93.4 %, | 35–44: 92.0 %, |
| Rank 13: | Austria, | all: 72.7 %, | 16–24: 88.3 %, | 25–34: 83.2 %, | 35–44: 82.7 %, |
| Rank 14: | Malta, | all: 71.4 %, | 16–24: 86.9 %, | 25–34: 86.3 %, | 35–44: 81.6 %, |
| Rank 15: | Spain, | all: 70.8 %, | 16–24: 80.8 %, | 25–34: 88.3 %, | 35–44: 82.4 %, |
| Rank 16: | Latvia, | all: 69.7 %, | 16–24: 85.7 %, | 25–34: 90.4 %, | 35–44: 87.7 %, |
| Rank 16: | Poland, | all: 69.7 %, | 16–24: 86.1 %, | 25–34: 92.4 %, | 35–44: 89.4 %, |
| Rank 18: | Greece, | all: 68.0 %, | 16–24: 91.3 %, | 25–34: 95.6 %, | 35–44: 80.7 %, |
| Rank 19: | Hungary, | all: 67.7 %, | 16–24: 79.4 %, | 25–34: 80.5 %, | 35–44: 77.1 %, |
| Rank 20: | Slovenia, | all: 66.9 %, | 16–24: 87.8 %, | 25–34: 82.5 %, | 35–44: 84.2 %, |
| Rank 21: | Lithuania, | all: 64.8 %, | 16–24: 86.2 %, | 25–34: 90.4 %, | 35–44: 84.3 %, |
| Rank 22: | Cyprus, | all: 63.4 %, | 16–24: 77.2 %, | 25–34: 88.0 %, | 35–44: 80.4 %, |
| Rank 23: | Croatia, | all: 61.7 %, | 16–24: 88.1 %, | 25–34: 87.7 %, | 35–44: 81.5 %, |
| Rank 24: | Portugal, | all: 60.5 %, | 16–24: 77.3 %, | 25–34: 86.6 %, | 35–44: 80.8 %, |
| Rank 25: | Romania, | all: 60.3 %, | 16–24: 77.0 %, | 25–34: 80.1 %, | 35–44: 73.9 %, |
| Rank 26: | Italy, | all: 56.2 %, | 16–24: 68.3 %, | 25–34: 73.8 %, | 35–44: 67.0 %, |
| Rank 27: | Bulgaria, | all: 51.2 %, | 16–24: 67.7 %, | 25–34: 70.8 %, | 35–44: 66.4 %, |
| all | 45–54 | 55–64 | 65–74 | ||
|---|---|---|---|---|---|
| EU, | all: 73.6 %, | 45–54: 77.2 %, | 55–64: 64.0 %, | 65–74: 44.4 %, | |
| Rank 1: | Ireland, | all: 95.1 %, | 45–54: 97.9 %, | 55–64: 90.5 %, | 65–74: 81.0 %, |
| Rank 2: | Netherlands, | all: 94.2 %, | 45–54: 96.2 %, | 55–64: 91.6 %, | 65–74: 84.0 %, |
| Rank 3: | Denmark, | all: 91.2 %, | 45–54: 92.4 %, | 55–64: 88.1 %, | 65–74: 82.3 %, |
| Rank 4: | Sweden, | all: 88.8 %, | 45–54: 92.4 %, | 55–64: 87.6 %, | 65–74: 76.0 %, |
| Rank 5: | Czechia, | all: 83.7 %, | 45–54: 90.4 %, | 55–64: 75.1 %, | 65–74: 46.3 %, |
| Rank 6: | Finland, | all: 82.0 %, | 45–54: 89.9 %, | 55–64: 76.1 %, | 65–74: 53.0 %, |
| Rank 7: | Germany, | all: 81.4 %, | 45–54: 84.5 %, | 55–64: 77.2 %, | 65–74: 61.0 %, |
| Rank 8: | France, | all: 80.2 %, | 45–54: 84.7 %, | 55–64: 72.7 %, | 65–74: 55.7 %, |
| Rank 9: | Luxembourg, | all: 80.1 %, | 45–54: 83.0 %, | 55–64: 71.2 %, | 65–74: 55.6 %, |
| Rank 10: | Slovakia, | all: 78.8 %, | 45–54: 83.9 %, | 55–64: 67.8 %, | 65–74: 44.8 %, |
| Rank 11: | Belgium, | all: 78.5 %, | 45–54: 81.0 %, | 55–64: 69.0 %, | 65–74: 50.5 %, |
| Rank 12: | Estonia, | all: 76.5 %, | 45–54: 81.4 %, | 55–64: 63.8 %, | 65–74: 36.4 %, |
| Rank 13: | Austria, | all: 72.7 %, | 45–54: 78.0 %, | 55–64: 60.3 %, | 65–74: 44.2 %, |
| Rank 14: | Malta, | all: 71.4 %, | 45–54: 72.6 %, | 55–64: 52.2 %, | 65–74: 28.0 %, |
| Rank 15: | Spain, | all: 70.8 %, | 45–54: 75.8 %, | 55–64: 58.9 %, | 65–74: 36.1 %, |
| Rank 16: | Latvia, | all: 69.7 %, | 45–54: 75.7 %, | 55–64: 53.6 %, | 65–74: 29.7 %, |
| Rank 16: | Poland, | all: 69.7 %, | 45–54: 74.1 %, | 55–64: 50.9 %, | 65–74: 25.0 %, |
| Rank 18: | Greece, | all: 68.0 %, | 45–54: 70.8 %, | 55–64: 56.5 %, | 65–74: 23.1 %, |
| Rank 19: | Hungary, | all: 67.7 %, | 45–54: 72.9 %, | 55–64: 57.7 %, | 65–74: 38.5 %, |
| Rank 20: | Slovenia, | all: 66.9 %, | 45–54: 71.2 %, | 55–64: 49.1 %, | 65–74: 33.0 %, |
| Rank 21: | Lithuania, | all: 64.8 %, | 45–54: 67.7 %, | 55–64: 43.4 %, | 65–74: 21.6 %, |
| Rank 22: | Cyprus, | all: 63.4 %, | 45–54: 66.5 %, | 55–64: 38.2 %, | 65–74: 16.4 %, |
| Rank 23: | Croatia, | all: 61.7 %, | 45–54: 66.1 %, | 55–64: 43.0 %, | 65–74: 17.0 %, |
| Rank 24: | Portugal, | all: 60.5 %, | 45–54: 70.2 %, | 55–64: 40.9 %, | 65–74: 19.8 %, |
| Rank 25: | Romania, | all: 60.3 %, | 45–54: 64.0 %, | 55–64: 46.7 %, | 65–74: 23.6 %, |
| Rank 26: | Italy, | all: 56.2 %, | 45–54: 61.1 %, | 55–64: 45.4 %, | 65–74: 28.8 %, |
| Rank 27: | Bulgaria, | all: 51.2 %, | 45–54: 55.3 %, | 55–64: 40.8 %, | 65–74: 17.7 %, |
Education
In 2025, 88.9% of people with high formal education in the EU bought online, against 51.0% of people with no or low formal education.
Share of people who bought online, by level of formal education, %
2025About the data
The share of people aged 16 to 74 who bought or ordered goods or services over the internet for private use in the 12 months before the survey.
Counted: people aged 16 to 74.
Left out:
- people living in institutions such as hospitals or prisons
Eurostat: “An online buyer is defined as an individual who bought or ordered goods or services on-line during the last 3 months or the last 12 months prior to the survey.” (source)
The data come from a sample survey, the EU survey on the use of ICT in households and by individuals. The national statistical institutes run it every year. The figures are what people reported about themselves.
How to read these numbers
How it is measured
A purchase counts when the person placed a binding, paid order on a website or in an app with the features of an online shop. Orders by email or text message do not count. Paying online for something ordered offline does not count. Free goods and services, and orders placed as part of work, do not count. Online bookings of accommodation, financial products, online lotteries and betting count.
This dataset starts in 2020. The figures for 2002 to 2019 are in a separate Eurostat dataset (isoc_ec_ibuy), because the survey questions changed.
Each person was asked about the 12 months before their interview, and the countries held their interviews at different times of the year. Most countries collected the data in the second quarter.
Revisions
In 2025 Hungary's statistical office (KSH) adapted its questionnaire to modernised data collection and took the population totals for weighting from the 2022 census. It marks no break in the series. Some 2025 values differ from 2024 more than expected, and the KSH has checked them and considers them valid.
Sources and data
Eurostat, Internet purchases by individuals (2020 onwards) (isoc_ec_ib20). Data updated 17 April 2026, retrieved 4 November 2026. Licence: CC BY 4.0.
Eurostat metadata · Eurostat methodology
https://ec.europa.eu/eurostat/api/dissemination/statistics/1.0/data/isoc_ec_ib20?format=JSON&lang=en&freq=A&geo=AT&geo=BE&geo=BG&geo=CY&geo=CZ&geo=DE&geo=DK&geo=EE&geo=EL&geo=ES&geo=EU27_2020&geo=FI&geo=FR&geo=HR&geo=HU&geo=IE&geo=IT&geo=LT&geo=LU&geo=LV&geo=MT&geo=NL&geo=PL&geo=PT&geo=RO&geo=SE&geo=SI&geo=SK&ind_type=IND_TOTAL&indic_is=I_BLT12&unit=PC_INDRelated stories
-
Who has never been online
In Croatia, 10.33% of people aged 16 to 74 have never used the internet, against 0.20% in Ireland (2025)
-
Who uses generative AI in the EU
In Denmark, the share of people using generative AI is 30.6 percentage points higher than in Romania (2025)
-
Electric cars among new cars
In Denmark, 67.8% of new cars were battery-only electric, against 1.9% in Croatia (2025)
-
Cars per 1,000 inhabitants
Italy has 1.6 times as many cars per inhabitant as Latvia (2025)