Behind on utility bills
Topic: Living conditions
31.9% of people in Greece could not pay their utility bills on time, against 2.2% in the Netherlands.
In 2025, 7.0% of people in the EU lived in a household that could not pay its utility bills on time at least once in the twelve months before the survey. Households say this themselves in a survey.
- Figures for:
- 2025.
- Covers:
- the time of the survey.
- New data:
- once a year.
- Dataset updated:
- 20 October 2026.
Published 4 November 2026
The ranking
In 2025, the share of people who could not pay their utility bills on time was highest in Greece, at 31.9%, and lowest in the Netherlands, at 2.2%.
Share of people who could not pay their utility bills on time, %
2025Over time
Share of people who could not pay their utility bills on time in the EU, %
2019–2025Between 2019 and 2025, the share fell in 17 countries and rose in 10.
Share of people who could not pay their utility bills on time, %
2019 and 2025 · ranked by 2025Poverty risk and late bills
Among people above the poverty threshold, the spread across countries was narrower. Greece was again the highest, at 23.5%, and Czechia the lowest, at 1.2%. The highest and the lowest were 22.3 percentage points apart.
Among people at risk of poverty, the spread across countries was much wider than among people above the poverty threshold. Greece was again the highest, at 66.5%, and Denmark the lowest, at 6.6%. The gap was 59.9 percentage points.
Share of people who could not pay their utility bills on time: above the poverty threshold and at risk of poverty, %
2025| Everyone | Above the poverty threshold | At risk of poverty | |
|---|---|---|---|
| Lowest | 2.2%the Netherlands | 1.2%Czechia | 6.6%Denmark |
| Highest | 31.9%Greece | 23.5%Greece | 66.5%Greece |
| Highest − lowest | 29.7 pp | 22.3 pp | 59.9 pp |
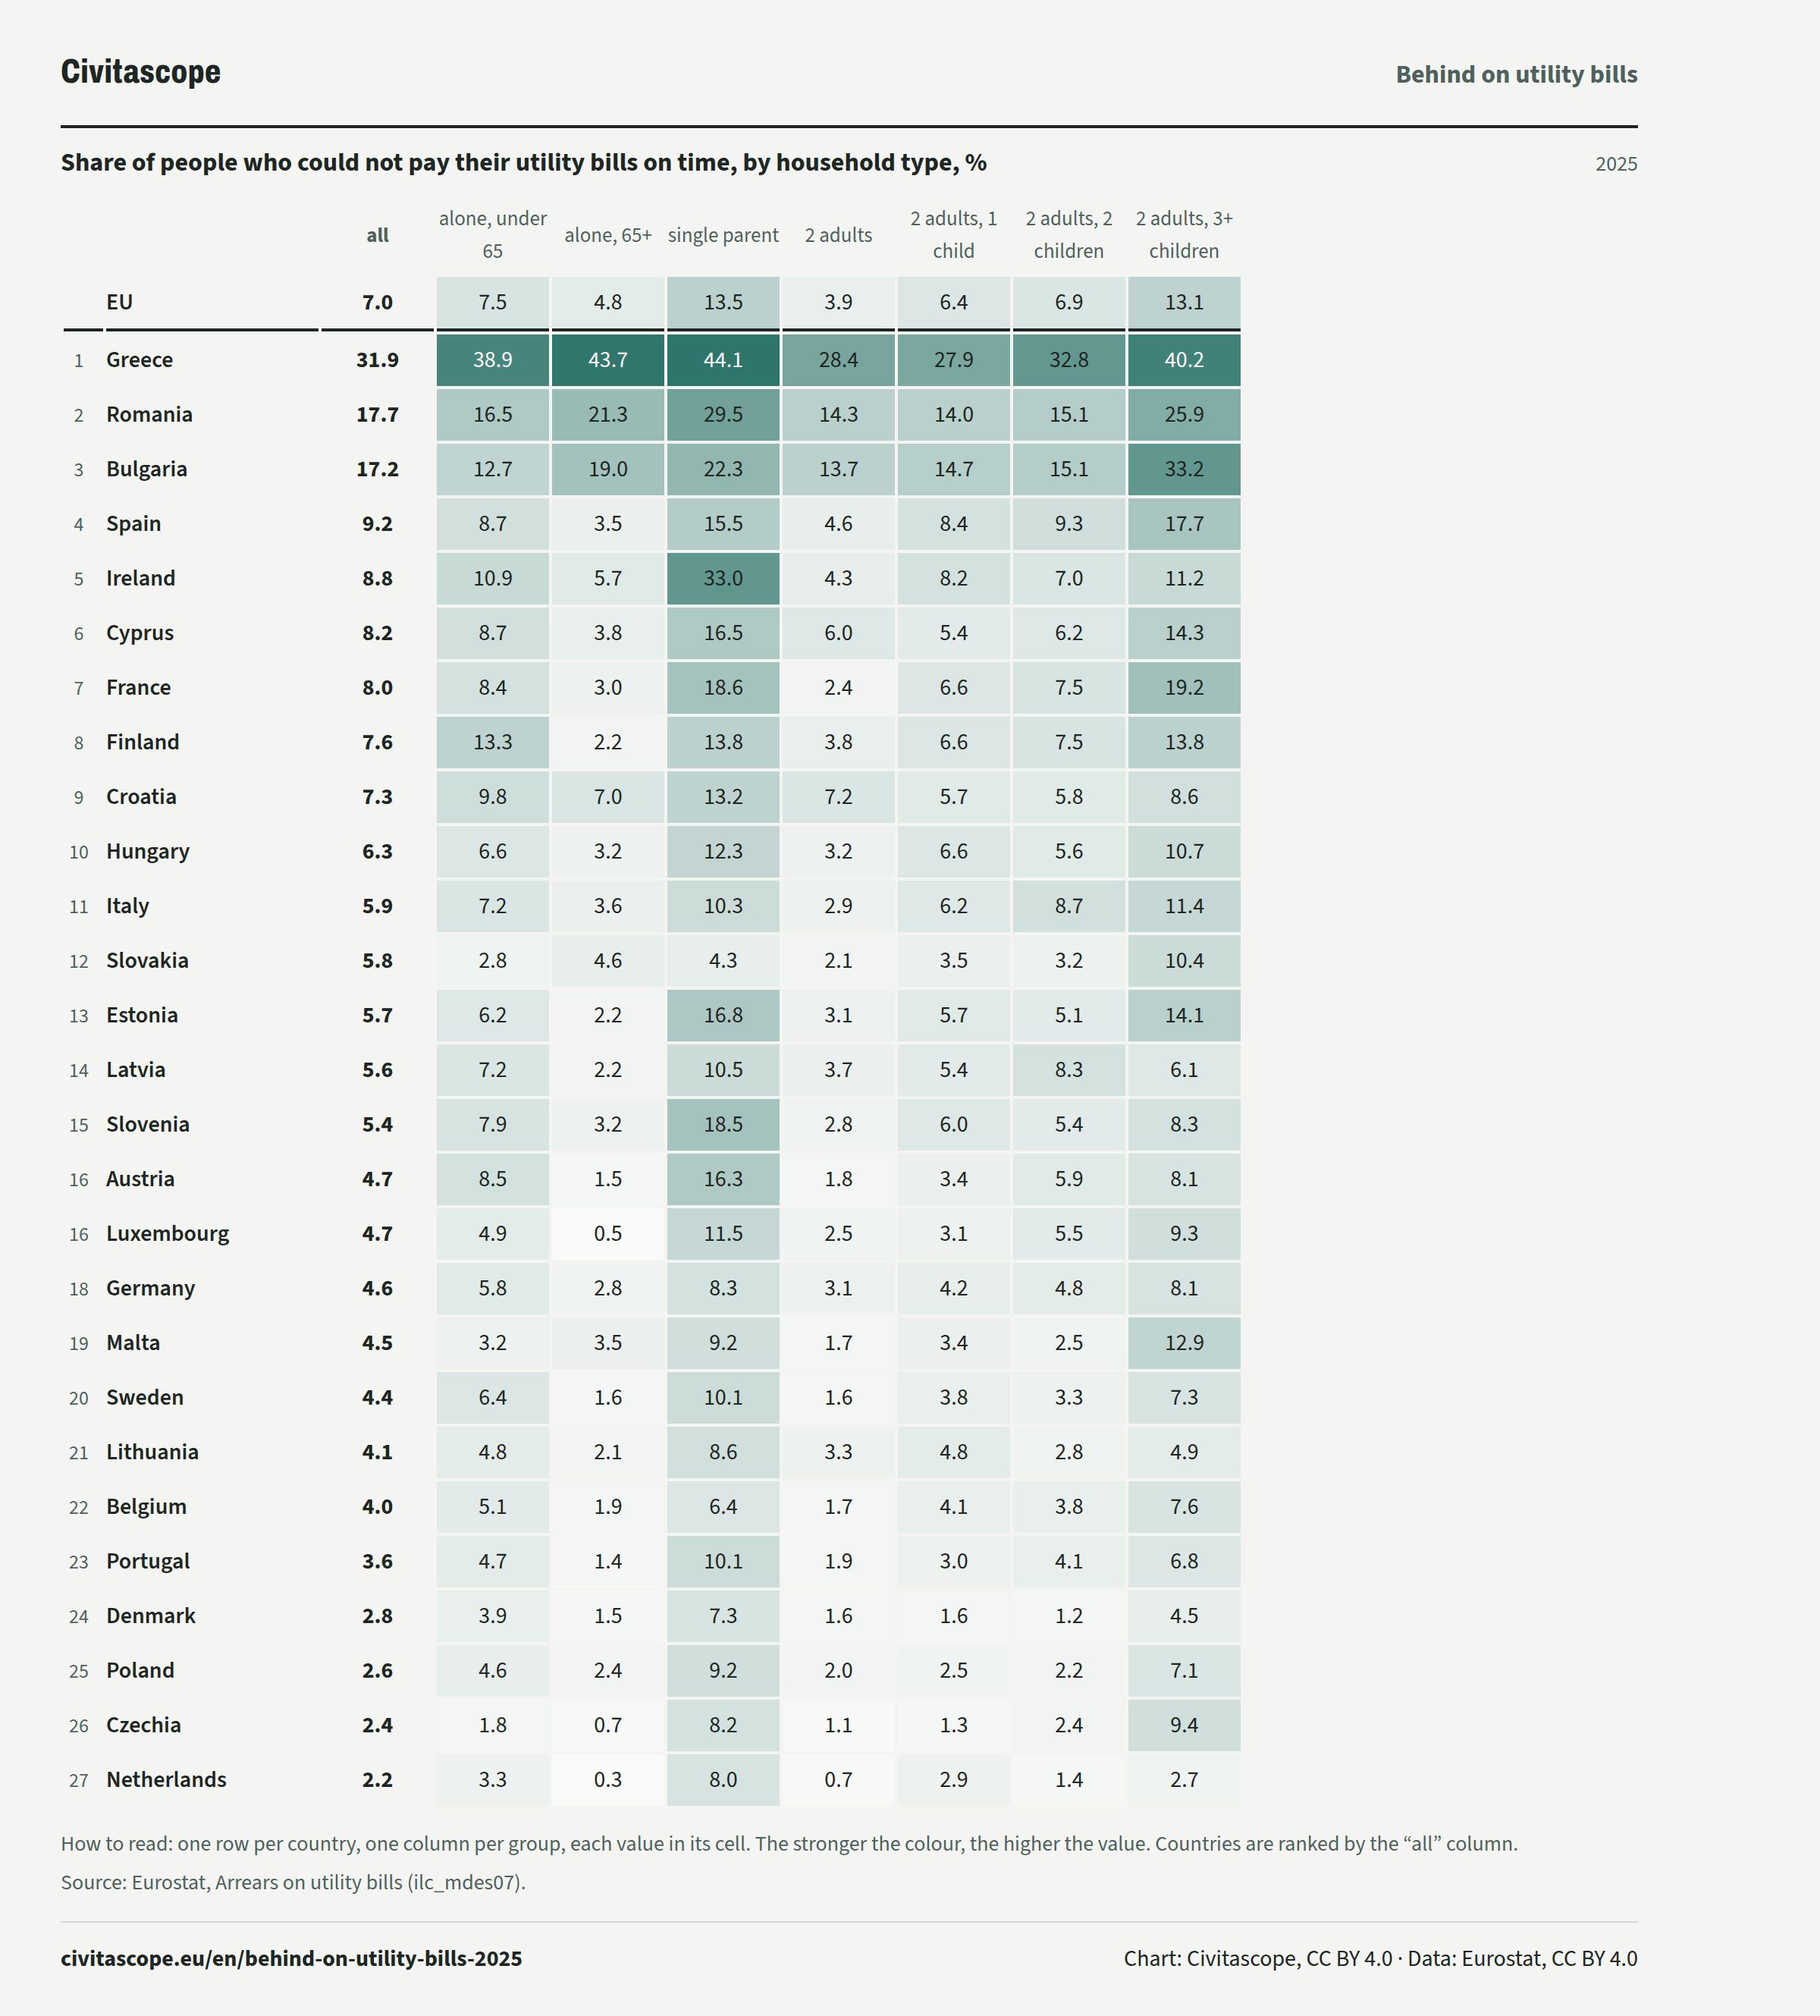
Single parents and large families
In 2025, 13.5% of people in single-parent households in the EU could not pay their utility bills on time, and 13.1% of people in households of two adults with three or more children.
Share of people who could not pay their utility bills on time, by household type, %
2025| all | alone, under 65 | alone, 65+ | single parent | 2 adults | 2 adults, 1 child | 2 adults, 2 children | 2 adults, 3+ children | ||
|---|---|---|---|---|---|---|---|---|---|
| EU, | all: 7.0 %, | alone, under 65: 7.5 %, | alone, 65+: 4.8 %, | single parent: 13.5 %, | 2 adults: 3.9 %, | 2 adults, 1 child: 6.4 %, | 2 adults, 2 children: 6.9 %, | 2 adults, 3+ children: 13.1 %, | |
| Rank 1: | Greece, | all: 31.9 %, | alone, under 65: 38.9 %, | alone, 65+: 43.7 %, | single parent: 44.1 %, | 2 adults: 28.4 %, | 2 adults, 1 child: 27.9 %, | 2 adults, 2 children: 32.8 %, | 2 adults, 3+ children: 40.2 %, |
| Rank 2: | Romania, | all: 17.7 %, | alone, under 65: 16.5 %, | alone, 65+: 21.3 %, | single parent: 29.5 %, | 2 adults: 14.3 %, | 2 adults, 1 child: 14.0 %, | 2 adults, 2 children: 15.1 %, | 2 adults, 3+ children: 25.9 %, |
| Rank 3: | Bulgaria, | all: 17.2 %, | alone, under 65: 12.7 %, | alone, 65+: 19.0 %, | single parent: 22.3 %, | 2 adults: 13.7 %, | 2 adults, 1 child: 14.7 %, | 2 adults, 2 children: 15.1 %, | 2 adults, 3+ children: 33.2 %, |
| Rank 4: | Spain, | all: 9.2 %, | alone, under 65: 8.7 %, | alone, 65+: 3.5 %, | single parent: 15.5 %, | 2 adults: 4.6 %, | 2 adults, 1 child: 8.4 %, | 2 adults, 2 children: 9.3 %, | 2 adults, 3+ children: 17.7 %, |
| Rank 5: | Ireland, | all: 8.8 %, | alone, under 65: 10.9 %, | alone, 65+: 5.7 %, | single parent: 33.0 %, | 2 adults: 4.3 %, | 2 adults, 1 child: 8.2 %, | 2 adults, 2 children: 7.0 %, | 2 adults, 3+ children: 11.2 %, |
| Rank 6: | Cyprus, | all: 8.2 %, | alone, under 65: 8.7 %, | alone, 65+: 3.8 %, | single parent: 16.5 %, | 2 adults: 6.0 %, | 2 adults, 1 child: 5.4 %, | 2 adults, 2 children: 6.2 %, | 2 adults, 3+ children: 14.3 %, |
| Rank 7: | France, | all: 8.0 %, | alone, under 65: 8.4 %, | alone, 65+: 3.0 %, | single parent: 18.6 %, | 2 adults: 2.4 %, | 2 adults, 1 child: 6.6 %, | 2 adults, 2 children: 7.5 %, | 2 adults, 3+ children: 19.2 %, |
| Rank 8: | Finland, | all: 7.6 %, | alone, under 65: 13.3 %, | alone, 65+: 2.2 %, | single parent: 13.8 %, | 2 adults: 3.8 %, | 2 adults, 1 child: 6.6 %, | 2 adults, 2 children: 7.5 %, | 2 adults, 3+ children: 13.8 %, |
| Rank 9: | Croatia, | all: 7.3 %, | alone, under 65: 9.8 %, | alone, 65+: 7.0 %, | single parent: 13.2 %, | 2 adults: 7.2 %, | 2 adults, 1 child: 5.7 %, | 2 adults, 2 children: 5.8 %, | 2 adults, 3+ children: 8.6 %, |
| Rank 10: | Hungary, | all: 6.3 %, | alone, under 65: 6.6 %, | alone, 65+: 3.2 %, | single parent: 12.3 %, | 2 adults: 3.2 %, | 2 adults, 1 child: 6.6 %, | 2 adults, 2 children: 5.6 %, | 2 adults, 3+ children: 10.7 %, |
| Rank 11: | Italy, | all: 5.9 %, | alone, under 65: 7.2 %, | alone, 65+: 3.6 %, | single parent: 10.3 %, | 2 adults: 2.9 %, | 2 adults, 1 child: 6.2 %, | 2 adults, 2 children: 8.7 %, | 2 adults, 3+ children: 11.4 %, |
| Rank 12: | Slovakia, | all: 5.8 %, | alone, under 65: 2.8 %, | alone, 65+: 4.6 %, | single parent: 4.3 %, | 2 adults: 2.1 %, | 2 adults, 1 child: 3.5 %, | 2 adults, 2 children: 3.2 %, | 2 adults, 3+ children: 10.4 %, |
| Rank 13: | Estonia, | all: 5.7 %, | alone, under 65: 6.2 %, | alone, 65+: 2.2 %, | single parent: 16.8 %, | 2 adults: 3.1 %, | 2 adults, 1 child: 5.7 %, | 2 adults, 2 children: 5.1 %, | 2 adults, 3+ children: 14.1 %, |
| Rank 14: | Latvia, | all: 5.6 %, | alone, under 65: 7.2 %, | alone, 65+: 2.2 %, | single parent: 10.5 %, | 2 adults: 3.7 %, | 2 adults, 1 child: 5.4 %, | 2 adults, 2 children: 8.3 %, | 2 adults, 3+ children: 6.1 %, |
| Rank 15: | Slovenia, | all: 5.4 %, | alone, under 65: 7.9 %, | alone, 65+: 3.2 %, | single parent: 18.5 %, | 2 adults: 2.8 %, | 2 adults, 1 child: 6.0 %, | 2 adults, 2 children: 5.4 %, | 2 adults, 3+ children: 8.3 %, |
| Rank 16: | Austria, | all: 4.7 %, | alone, under 65: 8.5 %, | alone, 65+: 1.5 %, | single parent: 16.3 %, | 2 adults: 1.8 %, | 2 adults, 1 child: 3.4 %, | 2 adults, 2 children: 5.9 %, | 2 adults, 3+ children: 8.1 %, |
| Rank 16: | Luxembourg, | all: 4.7 %, | alone, under 65: 4.9 %, | alone, 65+: 0.5 %, | single parent: 11.5 %, | 2 adults: 2.5 %, | 2 adults, 1 child: 3.1 %, | 2 adults, 2 children: 5.5 %, | 2 adults, 3+ children: 9.3 %, |
| Rank 18: | Germany, | all: 4.6 %, | alone, under 65: 5.8 %, | alone, 65+: 2.8 %, | single parent: 8.3 %, | 2 adults: 3.1 %, | 2 adults, 1 child: 4.2 %, | 2 adults, 2 children: 4.8 %, | 2 adults, 3+ children: 8.1 %, |
| Rank 19: | Malta, | all: 4.5 %, | alone, under 65: 3.2 %, | alone, 65+: 3.5 %, | single parent: 9.2 %, | 2 adults: 1.7 %, | 2 adults, 1 child: 3.4 %, | 2 adults, 2 children: 2.5 %, | 2 adults, 3+ children: 12.9 %, |
| Rank 20: | Sweden, | all: 4.4 %, | alone, under 65: 6.4 %, | alone, 65+: 1.6 %, | single parent: 10.1 %, | 2 adults: 1.6 %, | 2 adults, 1 child: 3.8 %, | 2 adults, 2 children: 3.3 %, | 2 adults, 3+ children: 7.3 %, |
| Rank 21: | Lithuania, | all: 4.1 %, | alone, under 65: 4.8 %, | alone, 65+: 2.1 %, | single parent: 8.6 %, | 2 adults: 3.3 %, | 2 adults, 1 child: 4.8 %, | 2 adults, 2 children: 2.8 %, | 2 adults, 3+ children: 4.9 %, |
| Rank 22: | Belgium, | all: 4.0 %, | alone, under 65: 5.1 %, | alone, 65+: 1.9 %, | single parent: 6.4 %, | 2 adults: 1.7 %, | 2 adults, 1 child: 4.1 %, | 2 adults, 2 children: 3.8 %, | 2 adults, 3+ children: 7.6 %, |
| Rank 23: | Portugal, | all: 3.6 %, | alone, under 65: 4.7 %, | alone, 65+: 1.4 %, | single parent: 10.1 %, | 2 adults: 1.9 %, | 2 adults, 1 child: 3.0 %, | 2 adults, 2 children: 4.1 %, | 2 adults, 3+ children: 6.8 %, |
| Rank 24: | Denmark, | all: 2.8 %, | alone, under 65: 3.9 %, | alone, 65+: 1.5 %, | single parent: 7.3 %, | 2 adults: 1.6 %, | 2 adults, 1 child: 1.6 %, | 2 adults, 2 children: 1.2 %, | 2 adults, 3+ children: 4.5 %, |
| Rank 25: | Poland, | all: 2.6 %, | alone, under 65: 4.6 %, | alone, 65+: 2.4 %, | single parent: 9.2 %, | 2 adults: 2.0 %, | 2 adults, 1 child: 2.5 %, | 2 adults, 2 children: 2.2 %, | 2 adults, 3+ children: 7.1 %, |
| Rank 26: | Czechia, | all: 2.4 %, | alone, under 65: 1.8 %, | alone, 65+: 0.7 %, | single parent: 8.2 %, | 2 adults: 1.1 %, | 2 adults, 1 child: 1.3 %, | 2 adults, 2 children: 2.4 %, | 2 adults, 3+ children: 9.4 %, |
| Rank 27: | Netherlands, | all: 2.2 %, | alone, under 65: 3.3 %, | alone, 65+: 0.3 %, | single parent: 8.0 %, | 2 adults: 0.7 %, | 2 adults, 1 child: 2.9 %, | 2 adults, 2 children: 1.4 %, | 2 adults, 3+ children: 2.7 %, |
| all | alone, under 65 | alone, 65+ | single parent | 2 adults | ||
|---|---|---|---|---|---|---|
| EU, | all: 7.0 %, | alone, under 65: 7.5 %, | alone, 65+: 4.8 %, | single parent: 13.5 %, | 2 adults: 3.9 %, | |
| Rank 1: | Greece, | all: 31.9 %, | alone, under 65: 38.9 %, | alone, 65+: 43.7 %, | single parent: 44.1 %, | 2 adults: 28.4 %, |
| Rank 2: | Romania, | all: 17.7 %, | alone, under 65: 16.5 %, | alone, 65+: 21.3 %, | single parent: 29.5 %, | 2 adults: 14.3 %, |
| Rank 3: | Bulgaria, | all: 17.2 %, | alone, under 65: 12.7 %, | alone, 65+: 19.0 %, | single parent: 22.3 %, | 2 adults: 13.7 %, |
| Rank 4: | Spain, | all: 9.2 %, | alone, under 65: 8.7 %, | alone, 65+: 3.5 %, | single parent: 15.5 %, | 2 adults: 4.6 %, |
| Rank 5: | Ireland, | all: 8.8 %, | alone, under 65: 10.9 %, | alone, 65+: 5.7 %, | single parent: 33.0 %, | 2 adults: 4.3 %, |
| Rank 6: | Cyprus, | all: 8.2 %, | alone, under 65: 8.7 %, | alone, 65+: 3.8 %, | single parent: 16.5 %, | 2 adults: 6.0 %, |
| Rank 7: | France, | all: 8.0 %, | alone, under 65: 8.4 %, | alone, 65+: 3.0 %, | single parent: 18.6 %, | 2 adults: 2.4 %, |
| Rank 8: | Finland, | all: 7.6 %, | alone, under 65: 13.3 %, | alone, 65+: 2.2 %, | single parent: 13.8 %, | 2 adults: 3.8 %, |
| Rank 9: | Croatia, | all: 7.3 %, | alone, under 65: 9.8 %, | alone, 65+: 7.0 %, | single parent: 13.2 %, | 2 adults: 7.2 %, |
| Rank 10: | Hungary, | all: 6.3 %, | alone, under 65: 6.6 %, | alone, 65+: 3.2 %, | single parent: 12.3 %, | 2 adults: 3.2 %, |
| Rank 11: | Italy, | all: 5.9 %, | alone, under 65: 7.2 %, | alone, 65+: 3.6 %, | single parent: 10.3 %, | 2 adults: 2.9 %, |
| Rank 12: | Slovakia, | all: 5.8 %, | alone, under 65: 2.8 %, | alone, 65+: 4.6 %, | single parent: 4.3 %, | 2 adults: 2.1 %, |
| Rank 13: | Estonia, | all: 5.7 %, | alone, under 65: 6.2 %, | alone, 65+: 2.2 %, | single parent: 16.8 %, | 2 adults: 3.1 %, |
| Rank 14: | Latvia, | all: 5.6 %, | alone, under 65: 7.2 %, | alone, 65+: 2.2 %, | single parent: 10.5 %, | 2 adults: 3.7 %, |
| Rank 15: | Slovenia, | all: 5.4 %, | alone, under 65: 7.9 %, | alone, 65+: 3.2 %, | single parent: 18.5 %, | 2 adults: 2.8 %, |
| Rank 16: | Austria, | all: 4.7 %, | alone, under 65: 8.5 %, | alone, 65+: 1.5 %, | single parent: 16.3 %, | 2 adults: 1.8 %, |
| Rank 16: | Luxembourg, | all: 4.7 %, | alone, under 65: 4.9 %, | alone, 65+: 0.5 %, | single parent: 11.5 %, | 2 adults: 2.5 %, |
| Rank 18: | Germany, | all: 4.6 %, | alone, under 65: 5.8 %, | alone, 65+: 2.8 %, | single parent: 8.3 %, | 2 adults: 3.1 %, |
| Rank 19: | Malta, | all: 4.5 %, | alone, under 65: 3.2 %, | alone, 65+: 3.5 %, | single parent: 9.2 %, | 2 adults: 1.7 %, |
| Rank 20: | Sweden, | all: 4.4 %, | alone, under 65: 6.4 %, | alone, 65+: 1.6 %, | single parent: 10.1 %, | 2 adults: 1.6 %, |
| Rank 21: | Lithuania, | all: 4.1 %, | alone, under 65: 4.8 %, | alone, 65+: 2.1 %, | single parent: 8.6 %, | 2 adults: 3.3 %, |
| Rank 22: | Belgium, | all: 4.0 %, | alone, under 65: 5.1 %, | alone, 65+: 1.9 %, | single parent: 6.4 %, | 2 adults: 1.7 %, |
| Rank 23: | Portugal, | all: 3.6 %, | alone, under 65: 4.7 %, | alone, 65+: 1.4 %, | single parent: 10.1 %, | 2 adults: 1.9 %, |
| Rank 24: | Denmark, | all: 2.8 %, | alone, under 65: 3.9 %, | alone, 65+: 1.5 %, | single parent: 7.3 %, | 2 adults: 1.6 %, |
| Rank 25: | Poland, | all: 2.6 %, | alone, under 65: 4.6 %, | alone, 65+: 2.4 %, | single parent: 9.2 %, | 2 adults: 2.0 %, |
| Rank 26: | Czechia, | all: 2.4 %, | alone, under 65: 1.8 %, | alone, 65+: 0.7 %, | single parent: 8.2 %, | 2 adults: 1.1 %, |
| Rank 27: | Netherlands, | all: 2.2 %, | alone, under 65: 3.3 %, | alone, 65+: 0.3 %, | single parent: 8.0 %, | 2 adults: 0.7 %, |
| all | 2 adults, 1 child | 2 adults, 2 children | 2 adults, 3+ children | ||
|---|---|---|---|---|---|
| EU, | all: 7.0 %, | 2 adults, 1 child: 6.4 %, | 2 adults, 2 children: 6.9 %, | 2 adults, 3+ children: 13.1 %, | |
| Rank 1: | Greece, | all: 31.9 %, | 2 adults, 1 child: 27.9 %, | 2 adults, 2 children: 32.8 %, | 2 adults, 3+ children: 40.2 %, |
| Rank 2: | Romania, | all: 17.7 %, | 2 adults, 1 child: 14.0 %, | 2 adults, 2 children: 15.1 %, | 2 adults, 3+ children: 25.9 %, |
| Rank 3: | Bulgaria, | all: 17.2 %, | 2 adults, 1 child: 14.7 %, | 2 adults, 2 children: 15.1 %, | 2 adults, 3+ children: 33.2 %, |
| Rank 4: | Spain, | all: 9.2 %, | 2 adults, 1 child: 8.4 %, | 2 adults, 2 children: 9.3 %, | 2 adults, 3+ children: 17.7 %, |
| Rank 5: | Ireland, | all: 8.8 %, | 2 adults, 1 child: 8.2 %, | 2 adults, 2 children: 7.0 %, | 2 adults, 3+ children: 11.2 %, |
| Rank 6: | Cyprus, | all: 8.2 %, | 2 adults, 1 child: 5.4 %, | 2 adults, 2 children: 6.2 %, | 2 adults, 3+ children: 14.3 %, |
| Rank 7: | France, | all: 8.0 %, | 2 adults, 1 child: 6.6 %, | 2 adults, 2 children: 7.5 %, | 2 adults, 3+ children: 19.2 %, |
| Rank 8: | Finland, | all: 7.6 %, | 2 adults, 1 child: 6.6 %, | 2 adults, 2 children: 7.5 %, | 2 adults, 3+ children: 13.8 %, |
| Rank 9: | Croatia, | all: 7.3 %, | 2 adults, 1 child: 5.7 %, | 2 adults, 2 children: 5.8 %, | 2 adults, 3+ children: 8.6 %, |
| Rank 10: | Hungary, | all: 6.3 %, | 2 adults, 1 child: 6.6 %, | 2 adults, 2 children: 5.6 %, | 2 adults, 3+ children: 10.7 %, |
| Rank 11: | Italy, | all: 5.9 %, | 2 adults, 1 child: 6.2 %, | 2 adults, 2 children: 8.7 %, | 2 adults, 3+ children: 11.4 %, |
| Rank 12: | Slovakia, | all: 5.8 %, | 2 adults, 1 child: 3.5 %, | 2 adults, 2 children: 3.2 %, | 2 adults, 3+ children: 10.4 %, |
| Rank 13: | Estonia, | all: 5.7 %, | 2 adults, 1 child: 5.7 %, | 2 adults, 2 children: 5.1 %, | 2 adults, 3+ children: 14.1 %, |
| Rank 14: | Latvia, | all: 5.6 %, | 2 adults, 1 child: 5.4 %, | 2 adults, 2 children: 8.3 %, | 2 adults, 3+ children: 6.1 %, |
| Rank 15: | Slovenia, | all: 5.4 %, | 2 adults, 1 child: 6.0 %, | 2 adults, 2 children: 5.4 %, | 2 adults, 3+ children: 8.3 %, |
| Rank 16: | Austria, | all: 4.7 %, | 2 adults, 1 child: 3.4 %, | 2 adults, 2 children: 5.9 %, | 2 adults, 3+ children: 8.1 %, |
| Rank 16: | Luxembourg, | all: 4.7 %, | 2 adults, 1 child: 3.1 %, | 2 adults, 2 children: 5.5 %, | 2 adults, 3+ children: 9.3 %, |
| Rank 18: | Germany, | all: 4.6 %, | 2 adults, 1 child: 4.2 %, | 2 adults, 2 children: 4.8 %, | 2 adults, 3+ children: 8.1 %, |
| Rank 19: | Malta, | all: 4.5 %, | 2 adults, 1 child: 3.4 %, | 2 adults, 2 children: 2.5 %, | 2 adults, 3+ children: 12.9 %, |
| Rank 20: | Sweden, | all: 4.4 %, | 2 adults, 1 child: 3.8 %, | 2 adults, 2 children: 3.3 %, | 2 adults, 3+ children: 7.3 %, |
| Rank 21: | Lithuania, | all: 4.1 %, | 2 adults, 1 child: 4.8 %, | 2 adults, 2 children: 2.8 %, | 2 adults, 3+ children: 4.9 %, |
| Rank 22: | Belgium, | all: 4.0 %, | 2 adults, 1 child: 4.1 %, | 2 adults, 2 children: 3.8 %, | 2 adults, 3+ children: 7.6 %, |
| Rank 23: | Portugal, | all: 3.6 %, | 2 adults, 1 child: 3.0 %, | 2 adults, 2 children: 4.1 %, | 2 adults, 3+ children: 6.8 %, |
| Rank 24: | Denmark, | all: 2.8 %, | 2 adults, 1 child: 1.6 %, | 2 adults, 2 children: 1.2 %, | 2 adults, 3+ children: 4.5 %, |
| Rank 25: | Poland, | all: 2.6 %, | 2 adults, 1 child: 2.5 %, | 2 adults, 2 children: 2.2 %, | 2 adults, 3+ children: 7.1 %, |
| Rank 26: | Czechia, | all: 2.4 %, | 2 adults, 1 child: 1.3 %, | 2 adults, 2 children: 2.4 %, | 2 adults, 3+ children: 9.4 %, |
| Rank 27: | Netherlands, | all: 2.2 %, | 2 adults, 1 child: 2.9 %, | 2 adults, 2 children: 1.4 %, | 2 adults, 3+ children: 2.7 %, |
About the data
The share of people living in households that were unable, because of financial difficulties, to pay their utility bills for the main dwelling, such as heating, electricity, gas or water, on time at least once in the twelve months before the survey.
Eurostat: “The indicator on arrears on utility bills refers to the percentage of persons in the total population who are in the state of arrears on utility bills, expressing the enforced inability to pay their utility bills on time due to financial difficulties.” (source)
EU statistics on income and living conditions (EU-SILC), a yearly sample survey of households run by the national statistical institutes. The answer is the household's own account.
How to read these numbers
How it is measured
The survey covers people living in private households. People in collective households and institutions are generally not included (Estonia includes collective households).
The figure is what households say about themselves. A household counts if it could not pay a utility bill on time at least once in the twelve months before the survey, because of financial difficulties. A bill that was paid only in part counts as in arrears. Water, sewage and rubbish bills count as well as energy. Telephone bills do not count. A bill paid late because it was forgotten does not count, and a bill paid by borrowing counts as paid.
People at risk of poverty are those whose equivalised disposable income is below their country's at-risk-of-poverty threshold. The threshold is derived from each country's own median income. It is therefore a different income level in each country. The income is that of the calendar year before the survey (in Ireland until 2019, the twelve months before the interview).
Revisions
Eurostat revised Hungary's EU-SILC data for 2019 to 2024 in October 2025, with population figures from the 2022 census. The income data for 2019 to 2022 were also imputed by a revised method.
Breaks in the series
Eurostat's metadata say that from 2020, and in particular from 2021, the series of many countries had breaks, in part or in full. They concern Belgium, Germany, Denmark, Ireland, France, Croatia, Lithuania, Luxembourg, Hungary, Malta, Poland, Portugal, Slovenia, Finland and Sweden.
A break in the series (flag b) means that a value is not fully comparable with the years before it. This concerns France (2020, 2022), Germany (2020), Ireland (2020), Luxembourg (2020–2022, 2025) and Portugal (2021).
Provisional figures
A provisional value (flag p) may still be revised. This concerns Lithuania (2025).
Sources and data
Eurostat, Arrears on utility bills (ilc_mdes07). Data updated 20 October 2026, retrieved 4 November 2026. Licence: CC BY 4.0.
Eurostat metadata · Eurostat methodology
https://ec.europa.eu/eurostat/api/dissemination/statistics/1.0/data/ilc_mdes07?format=JSON&lang=en&freq=A&geo=AT&geo=BE&geo=BG&geo=CY&geo=CZ&geo=DE&geo=DK&geo=EE&geo=EL&geo=ES&geo=EU27_2020&geo=FI&geo=FR&geo=HR&geo=HU&geo=IE&geo=IT&geo=LT&geo=LU&geo=LV&geo=MT&geo=NL&geo=PL&geo=PT&geo=RO&geo=SE&geo=SI&geo=SK&hhcomp=TOTAL&rskpovth=TOTAL&unit=PCRelated stories
-
How satisfied people are with their lives
In Finland and Romania, people rate their life 7.8 out of 10 on average, against 6.3 out of 10 in Bulgaria (2025)
-
Risk of poverty or social exclusion
The risk of poverty or social exclusion ranges from 11.5% in Czechia to 29.0% in Bulgaria (2025)
-
Who cannot keep their home warm
18.1% of people in Greece cannot afford to keep their home warm, against 2.6% in Finland (2025)
-
Who owns their home and who rents
In Slovakia, 93.8% of people live in a home their household owns, against 47.2% in Germany (2025)